- In 2022, there were 235,086,153 licensed drivers and 303,528,576 registered vehicles in the United States. These drivers drove a total of 3,196,191 million (i.e., over three trillion) vehicle miles that year. (NHTSA, August 2024)
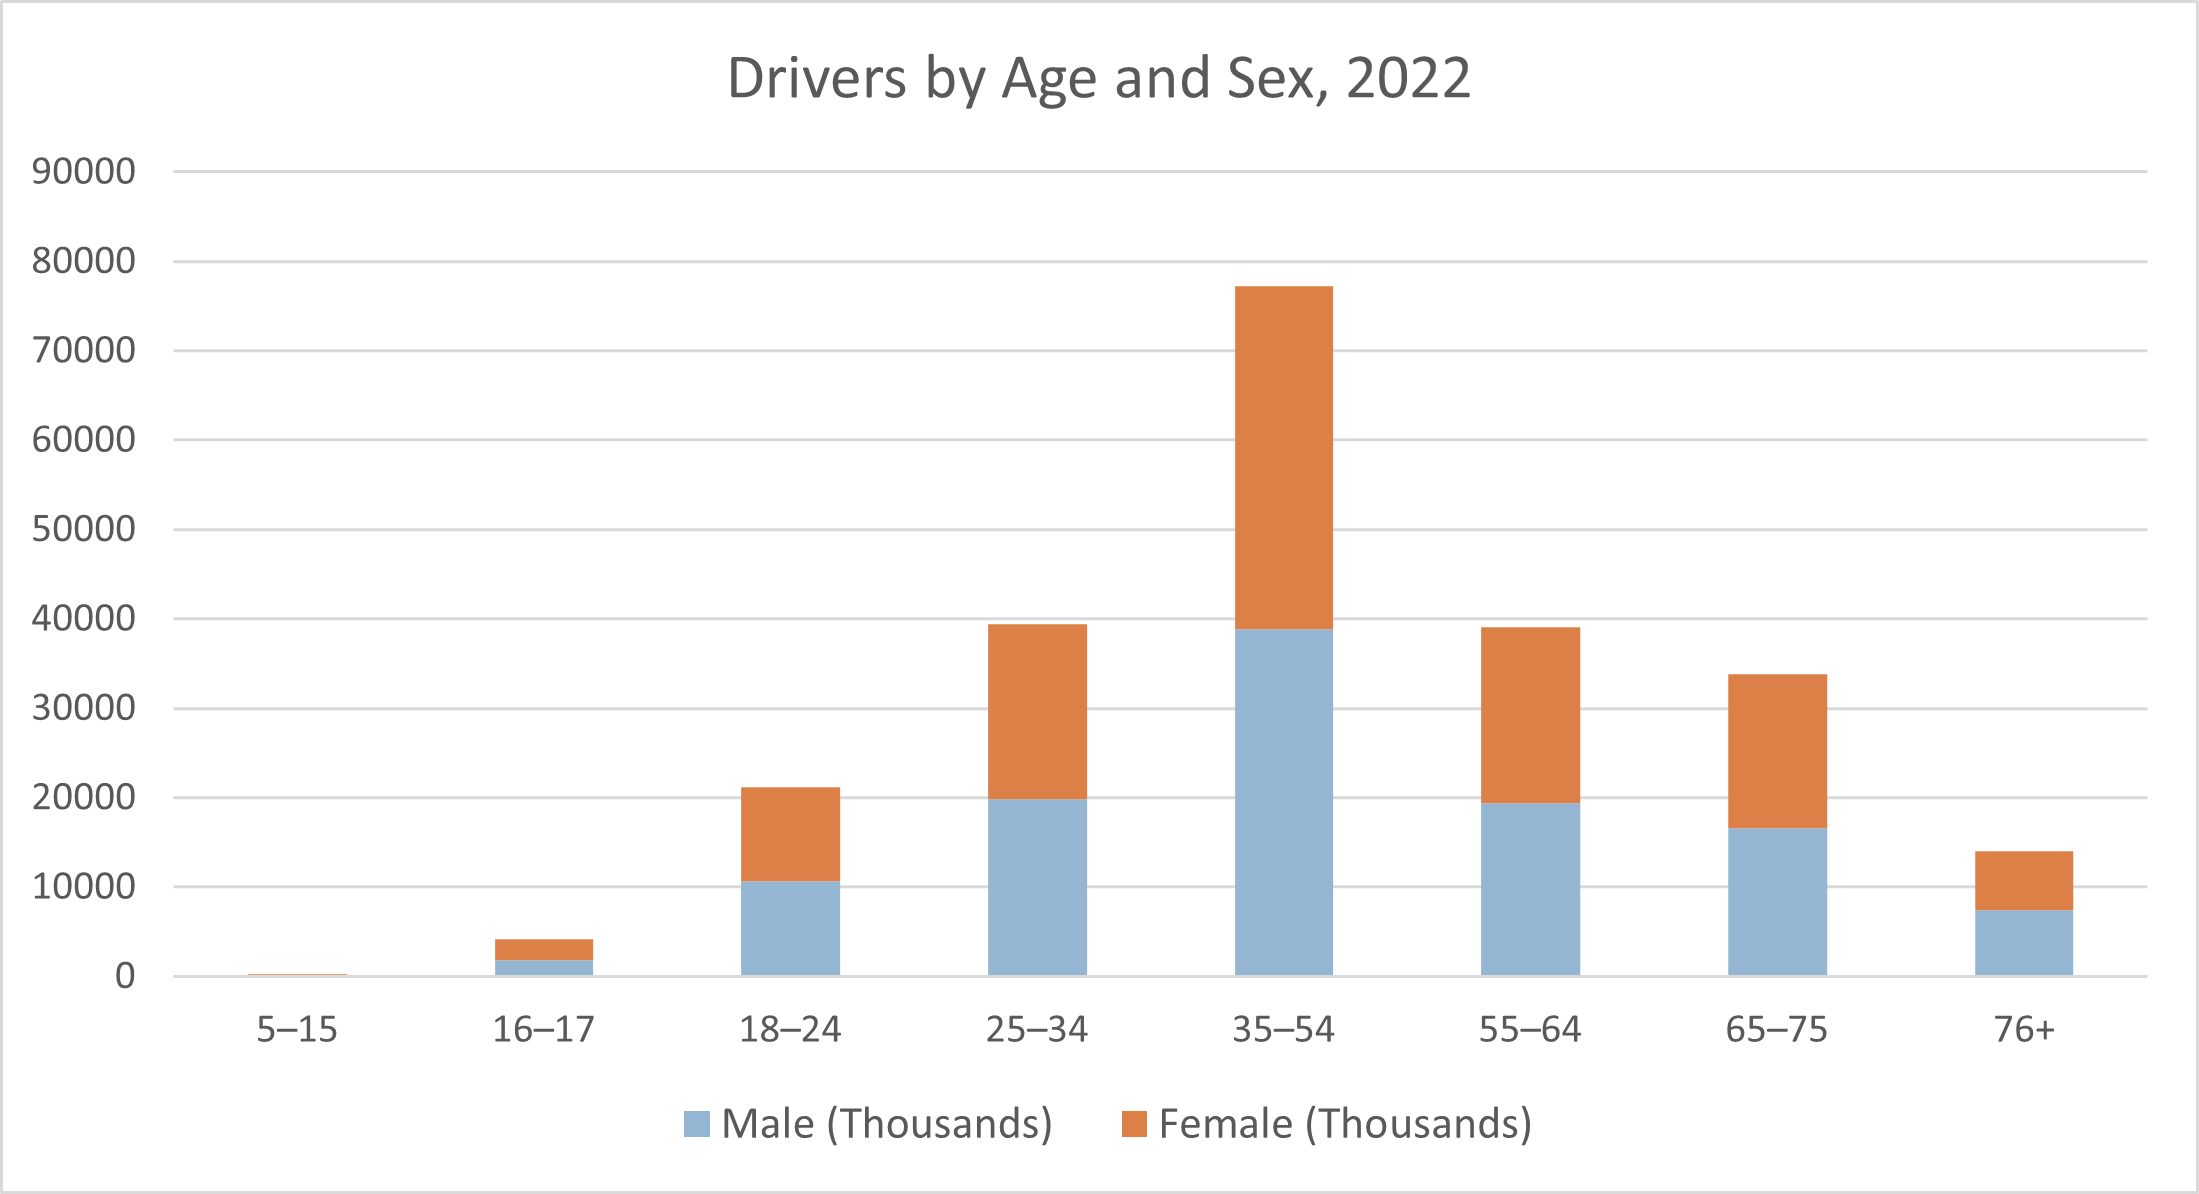
- From a survey of over 13,000 drivers conducted in 2022, it was estimated that there were more American drivers aged 35–54 than drivers of any other age group, and there were fewer American drivers under 18 years of age than drivers of any other age group. This also held true for drivers of both sexes. See the following chart. (National Household Travel Survey, Federal Highway Administration, 2022)
- In 2022, there were 51.5 million licensed drivers aged 65 or older, a 40% increase from 2013. In that same period, the total number of licensed drivers increased by just 11%. In 2013, 17% of licensed drivers were aged 65 or older; by 2022, that percentage had climbed to 22%. (NHTSA, August 2024)
- In 2022, 4,316,198 persons (1,996,819 males, 2,319,380 females) aged 85 and older held a driver’s license. Drivers aged 85 and older continue to be one of the fastest-growing parts of the US driving population. (FHWA, April 2024)
- South Dakota is the only state in the United States in which a resident can drive unsupervised at age 14½. New Jersey is the only state in which a resident cannot drive unsupervised until age 17½ (if the person has not completed driver education). (IIHS, March 2025)
- A survey of about 5,100 participants in 2023 found that 95.3% of residents aged 16 and older drove at least occasionally. Residents aged 35–49 drove the most; 97.5% of them drove at least occasionally. Residents aged 16–19 drove the least; 88,3% of them drove at least occasionally. 95.5% of men drove at least occasionally; a slightly smaller proportion of women (95.0%) drove at least occasionally. (AAA Foundation for Traffic Safety, August 2024)
- A survey of about 5,100 participants in 2023 found that drivers made an average of 2.43 driving trips per day. Male drivers made 2.46 trips daily, and women made 2.40 trips daily. Drivers aged 35ؘ–49 made the most trips (2.82) per day;
- drivers aged 20–24 made the fewest trips (1.79) per day. These figures represented a qualitative change from 2020 and 2021, when drivers aged 16–19 made the fewest trips per day. The number of trips varied significantly by education level. Drivers with less than a high-school diploma made an average of 2.14 trips per day; college graduates made 2.69 trips per day. (AAA Foundation for Traffic Safety, August 2024)
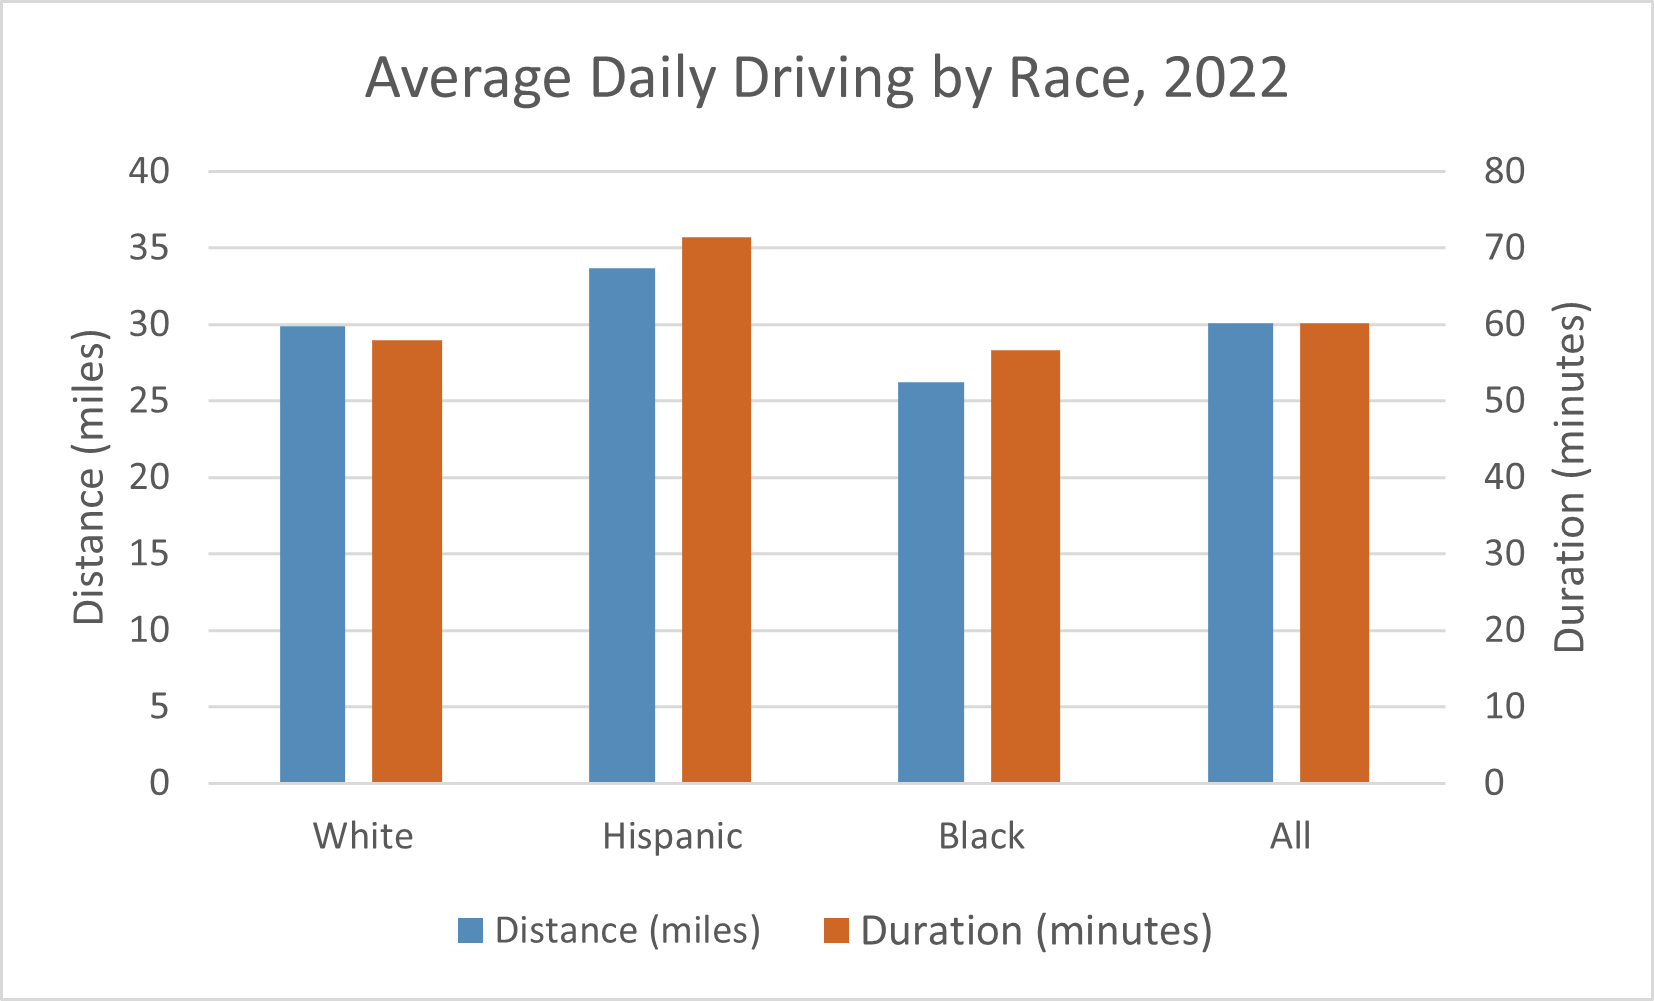
- A survey of about 5,100 participants in 2023 found that drivers drove for an average of 29.1 miles per day and 60.7 minutes per day. Hispanic drivers drove for an average of 30.1 miles per day and 70.9 minutes per day. White drivers drove for an average of 29.1 miles per day and 56.5 minutes per day. Black drivers drove for an average of 29.9 miles per day and 70.7 minutes per day. See the following chart. (AAA Foundation for Traffic Safety, August 2024)
- That same survey found that married drivers drove an average of 64.1 minutes and 32.5 miles per day, more than those of any other marital status. Widowed drivers drove least of all: an average of 40.7 minutes and 19.4 miles per day. (AAA Foundation for Traffic Safety, August 2024)
- The percentage of teenagers who hold a driver's license has declined since the 1980s (although there has been a slight uptick since 2014). For example, in 1983, 46.2% of 16-year-olds held a driver's license. In April 2024, only 24.9% of 16-year-olds held a driver's license. (Federal Highway Administration, 2024)
- In 2022, there were about 34 million licensed drivers aged 70 and older, a 92% increase from 1997. In 1997, 73% of persons aged 70 and older held driver’s licenses; in 2022, 87% of persons aged 70 and older did. (IIHS, July 2024)
- In 2023, there were 4,372,601 licensed drivers ages 85 and older, representing 1.8% of all licensed drivers. (FHWA, January 2025)
- In December 2024, there were about 4,092,200 registered electric vehicles (EVs), representing about 1.4% of the 292.3 million registered cars and light-duty trucks. These numbers represent a sharp increase from the year before, when there were 2,442,270 registered EVs. (Montoya, Ronald, Edmunds.com, April 2025)
- In 2024, 9.2% of new individual vehicle registrations were for electric vehicles (EVs), up from about 8% in 2023. (Experian Automotive, accessed May 2025)
- In 2024, 20.0% of light-duty vehicles (LDVs) sold were electric vehicles (EVs), an all-time high. LDVs are typically defined as vehicles whose Gross Vehicle Weight Rating (GVWR) is less than 10,000 pounds, such as cars, SUVs, vans, and pickup trucks. (Zhou, Yan, Argonne National Laboratory, accessed May 2025)
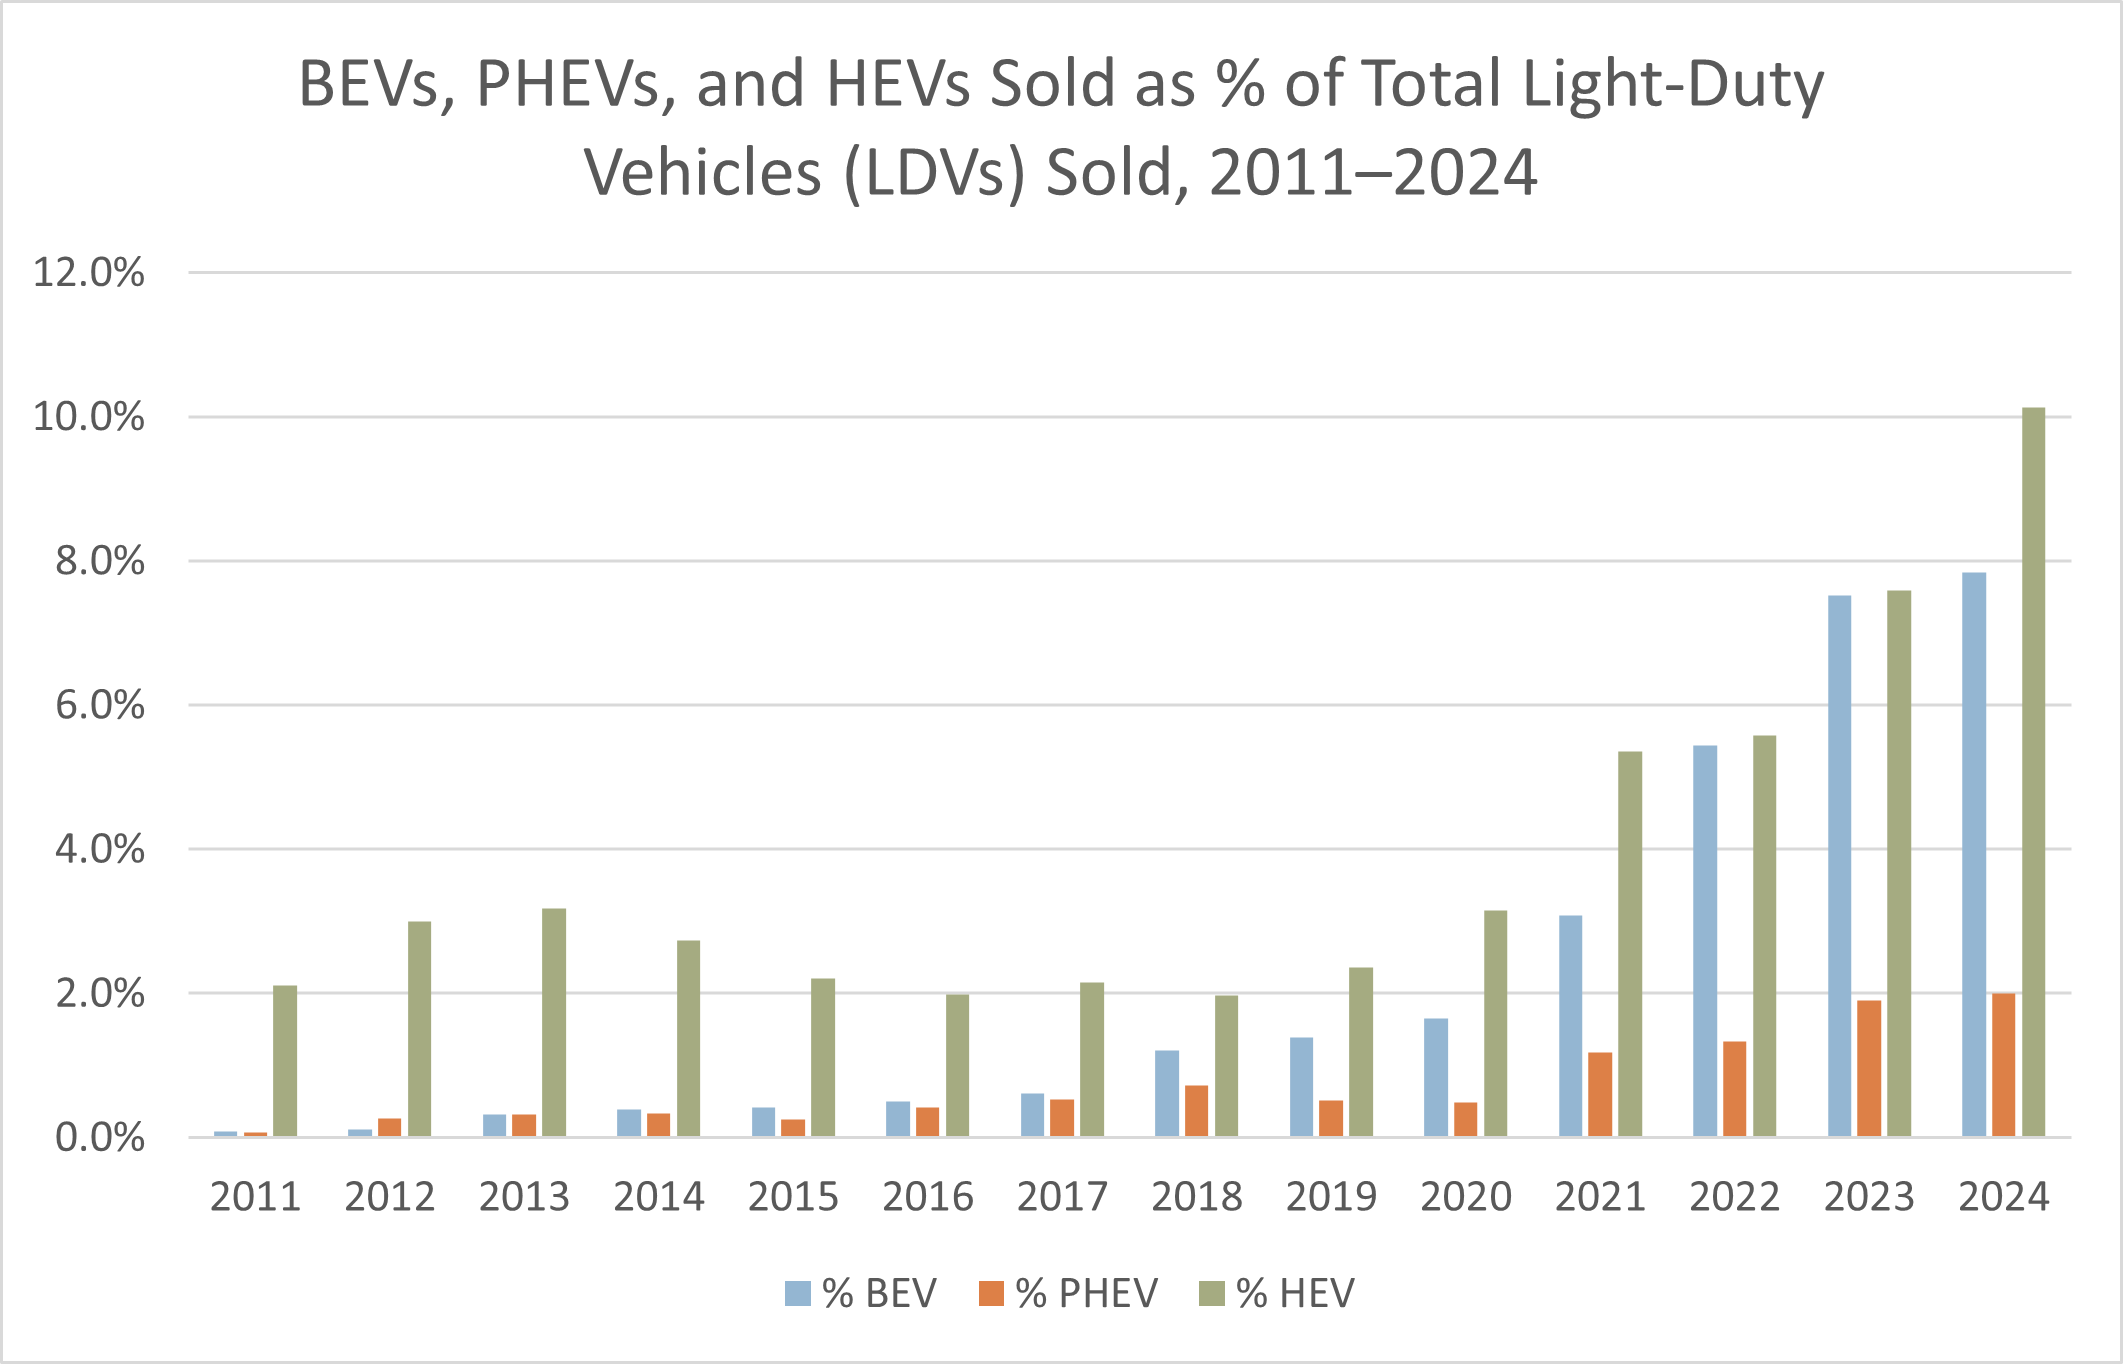
- In 2024, electric vehicle (EV) sales comprised 1,244,357 battery electric vehicles (BEVs), 317,872 plug-in hybrid electric vehicles (PHEVs), and 1,609,049 hybrid electric vehicles (HEVs). These figures represent new all-time highs for sales of all three types of EVs. As percentages of total light-duty vehicle sales, all three categories of EVs also reached new all-time highs: 7.8% for BEVs, 2.0% for PHEVs, and 10.1% for HEVs. See the following chart. (Zhou, Yan, Argonne National Laboratory, accessed May 2025)
- Among owners of battery electric vehicles (BEVs), 67% are male, 62% are white, 72% are in a long-term relationship (married, cohabiting, domestic partners, etc.), 68% are under the age of 45, 56% have a college degree or higher, and 62% earn $100,000 per year or more. (Mullen Automotive, Inc., 2025)
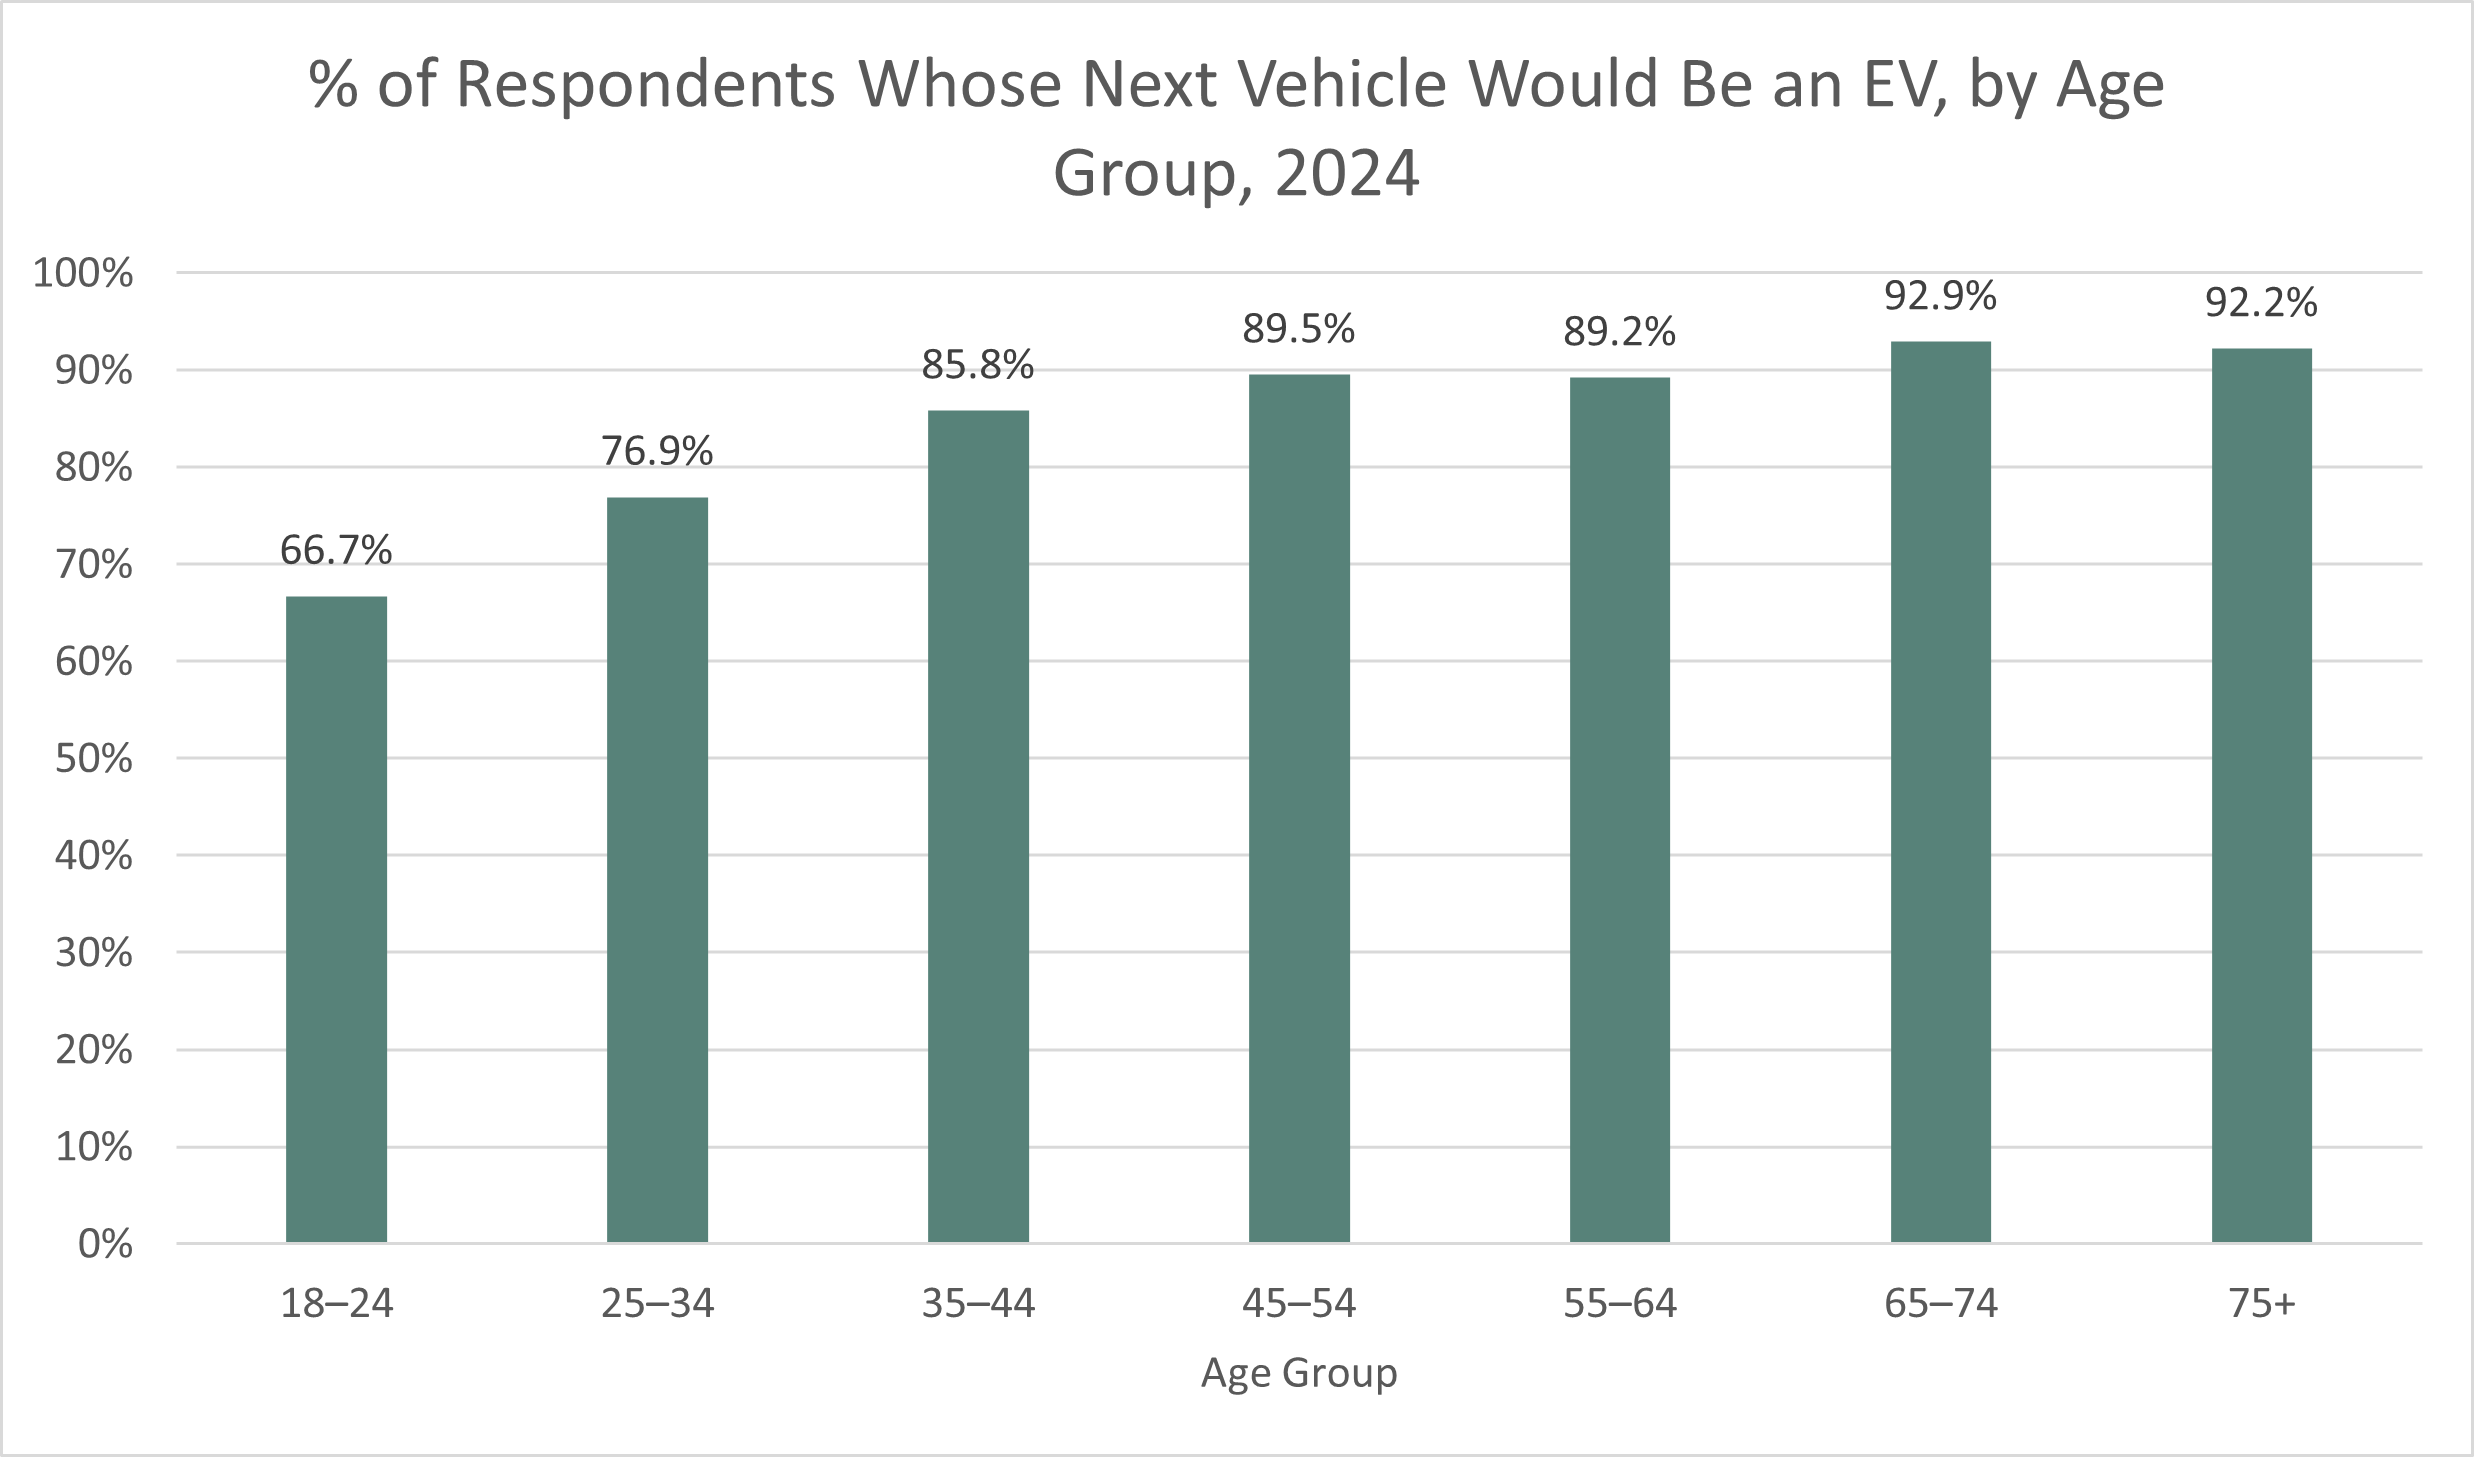
- In a 2024 survey of over 4,200 respondents, including 3,300 EV drivers, the most frequently cited reason for purchasing an electric vehicle (EV) was clean air/environmental protection (40.7%), followed by cost savings (19.2%) and performance/fun to drive (13.3%). 89.4% of respondents said it was likely or very likely that the next vehicle they purchased would be an EV. Generally, older drivers were even more likely to purchase an EV next time, whereas young drivers were less likely. See the following chart. (Plug In America, accessed May 2025)
- In 2002, there were about 4.3 million registered on-road motorcycles in the United States. By 2023, the number of registered on-road motorcycles had more than doubled, to about 8.8 million. (IIHS, June 2023)
- In 2022, 7–9% of US households owned motorcycles. 90% of households owning motorcycles also owned a car or truck. (Motorcycle Industry Council, 2023)
- In 2023, the largest single category of registered on-road motorcycles was cruisers (38.2% of registered motorcycles), followed by touring motorcycles (23.5%). Supersport motorcycles made up about 5.7% of registered on-road motorcycles. (IIHS, June 2023)
- In 2018, the average age of motorcycle owners was 50; in 1980, the average age was just 27. (IIHS, December 2024)
- In 2019, 81% of motorcycle owners were male, and 19% were female. (IIHS, December 2024)
- In 2022, there were 14.33 million combination and single-unit trucks registered, representing about 5% of all motor vehicles registered. There were over 577,000 active motor carriers registered with FMCSA that operated at least one tractor. 95.5% of them operated 10 or fewer trucks. (American Trucking Associations, accessed March 2025)
- In 2022, 476,000 trucks were sold. More than 29,000 were Class 8 trucks (heavy-duty combination trucks whose GVWR was at least 33,001 pounds).
- In 2022, combination trucks (semi-trucks and tractor-trailers) traveled 195.05 billion miles. Combination and single-unit trucks traveled a combined total of 331.27 billion miles. (American Trucking Associations, December 2024)
- In 2023, there were 3.55 million truck drivers employed in the United States. (American Trucking Associations, December 2024)
- There are 587,000 self-employed truck drivers (owner-operators), representing about 16% of all truck drivers. (TruckInfo.net, February 2025)
- An online survey of 2,097 truck drivers from August through September 2021 examined the motivating factors behind each respondent’s choice of becoming a Company Driver or an owner-operator/independent carrier (OO/IC), as well as the current level of driver satisfaction with each factor.
- Among Company Drivers, the top three motivating factors were Job Security/Stability (88.5%), Income (83.1%), and Healthcare/Retirement Savings (79.1%). However, only 59.5% of Company Drivers reported being satisfied with their Healthcare/Retirement Savings. Among female Company Drivers, 84.3% indicated Healthcare/Retirement Savings was an important motivating factor for becoming a Company Driver, and 68.6% of female drivers reported being satisfied with Healthcare/Retirement Savings.
- Among OO/ICs, the top three motivating factors were Independence/Ability to Set Hours (94.8%), Schedule/Flexibility (93.6%), and Choice of Routes/Length of Haul (91.3%). In contrast with Company Drivers, only 39.2% of OO/ICs rated Healthcare/Retirement Savings as a top motivating factor. (American Transportation Research Institute, 2022)
- As of December 2023, there were about 9 million commercial motor vehicle (CMV) drivers in the United States, although not all held commercial driver’s licenses (CDLs). 3.7 million CMV drivers operated interstate and held CDLs. 1.6 million CMV drivers operated intrastate and held CDLs. (FMCSA, December 2023)
- Studies have shown that long-haul truck drivers (LHTDs) are in significantly worse health than the general working adult population. 51% of LHTDs smoke cigarettes, compared with just 19% of working adults. 69% of LHTDs are obese (BMI ≥ 30), compared with 31% of working adults. 17% of LHTDs are morbidly obese (BMI ≥ 40), compared with just 7% of working adults. 14% of LHTDs have diabetes, compared with 7% of working adults. 33% of LHTDs have hypertension (high blood pressure), compared with 26% of working adults. Only 8% of LHTDs exercise regularly, compared with 25% of working adults. (National Institute for Occupational Safety and Health, 2015; Clear Roads Research, 2022)
- 28% of commercial truck drivers have mild to severe sleep apnea. (Obesity and smoking, which are both common among truckers, are known risk factors for sleep apnea.) (FMCSA, 2023)
- Another major health risk (as well as a safety risk) for commercial motor vehicle (CMV) drivers is fatigued (drowsy) driving. In various studies, 20% of drivers reported frequent drowsy driving, and 13% reported falling asleep at the wheel. Drivers reporting drowsy driving were 4.5 times more likely to be involved in a crash or near miss. (Sieber et al., American Journal of Industrial Medicine; 2014; Thiese et al., JOEM, 2015)
- An online survey of 2,097 truck drivers in August–September 2021 found that more than 8% were female; 14.5% of company drivers and 14.9% of owner-operator/independent carrier drivers (OO/ICs) were college graduates; and 1.6% of company drivers and 2.4% of OO/ICs had a master’s degree. (American Transportation Research Institute, 2022)
- That same survey found that 68.6% of OO/IC respondents were part of small operations (1–5 trucks), whereas 72.7% of Company Driver respondents worked for fleets with 21 – 1,000+ trucks. Five-axle flatbed trucks were more common among OO/ICs leased to a motor carrier (22.6%) and OO/ICs with their own authority to transport freight (17.6%) than among Company Drivers (5.8%). On the other hand, 5-axle tanker trucks were more common among Company Drivers (9.7%) than among OO/ICs leased to a motor carrier (4.6%) or OO/ICs with their own authority (2.5%). (American Transportation Research Institute, 2022)
- That same survey found that longer trip lengths were more prevalent among OO/IC respondents. 73.9% of OO/IC respondents reported average length of haul exceeding 500 miles per trip. Among Company Driver respondents, 55.4% reported operating local or regional trips of less than 500 miles per trip. (American Transportation Research Institute, 2022)
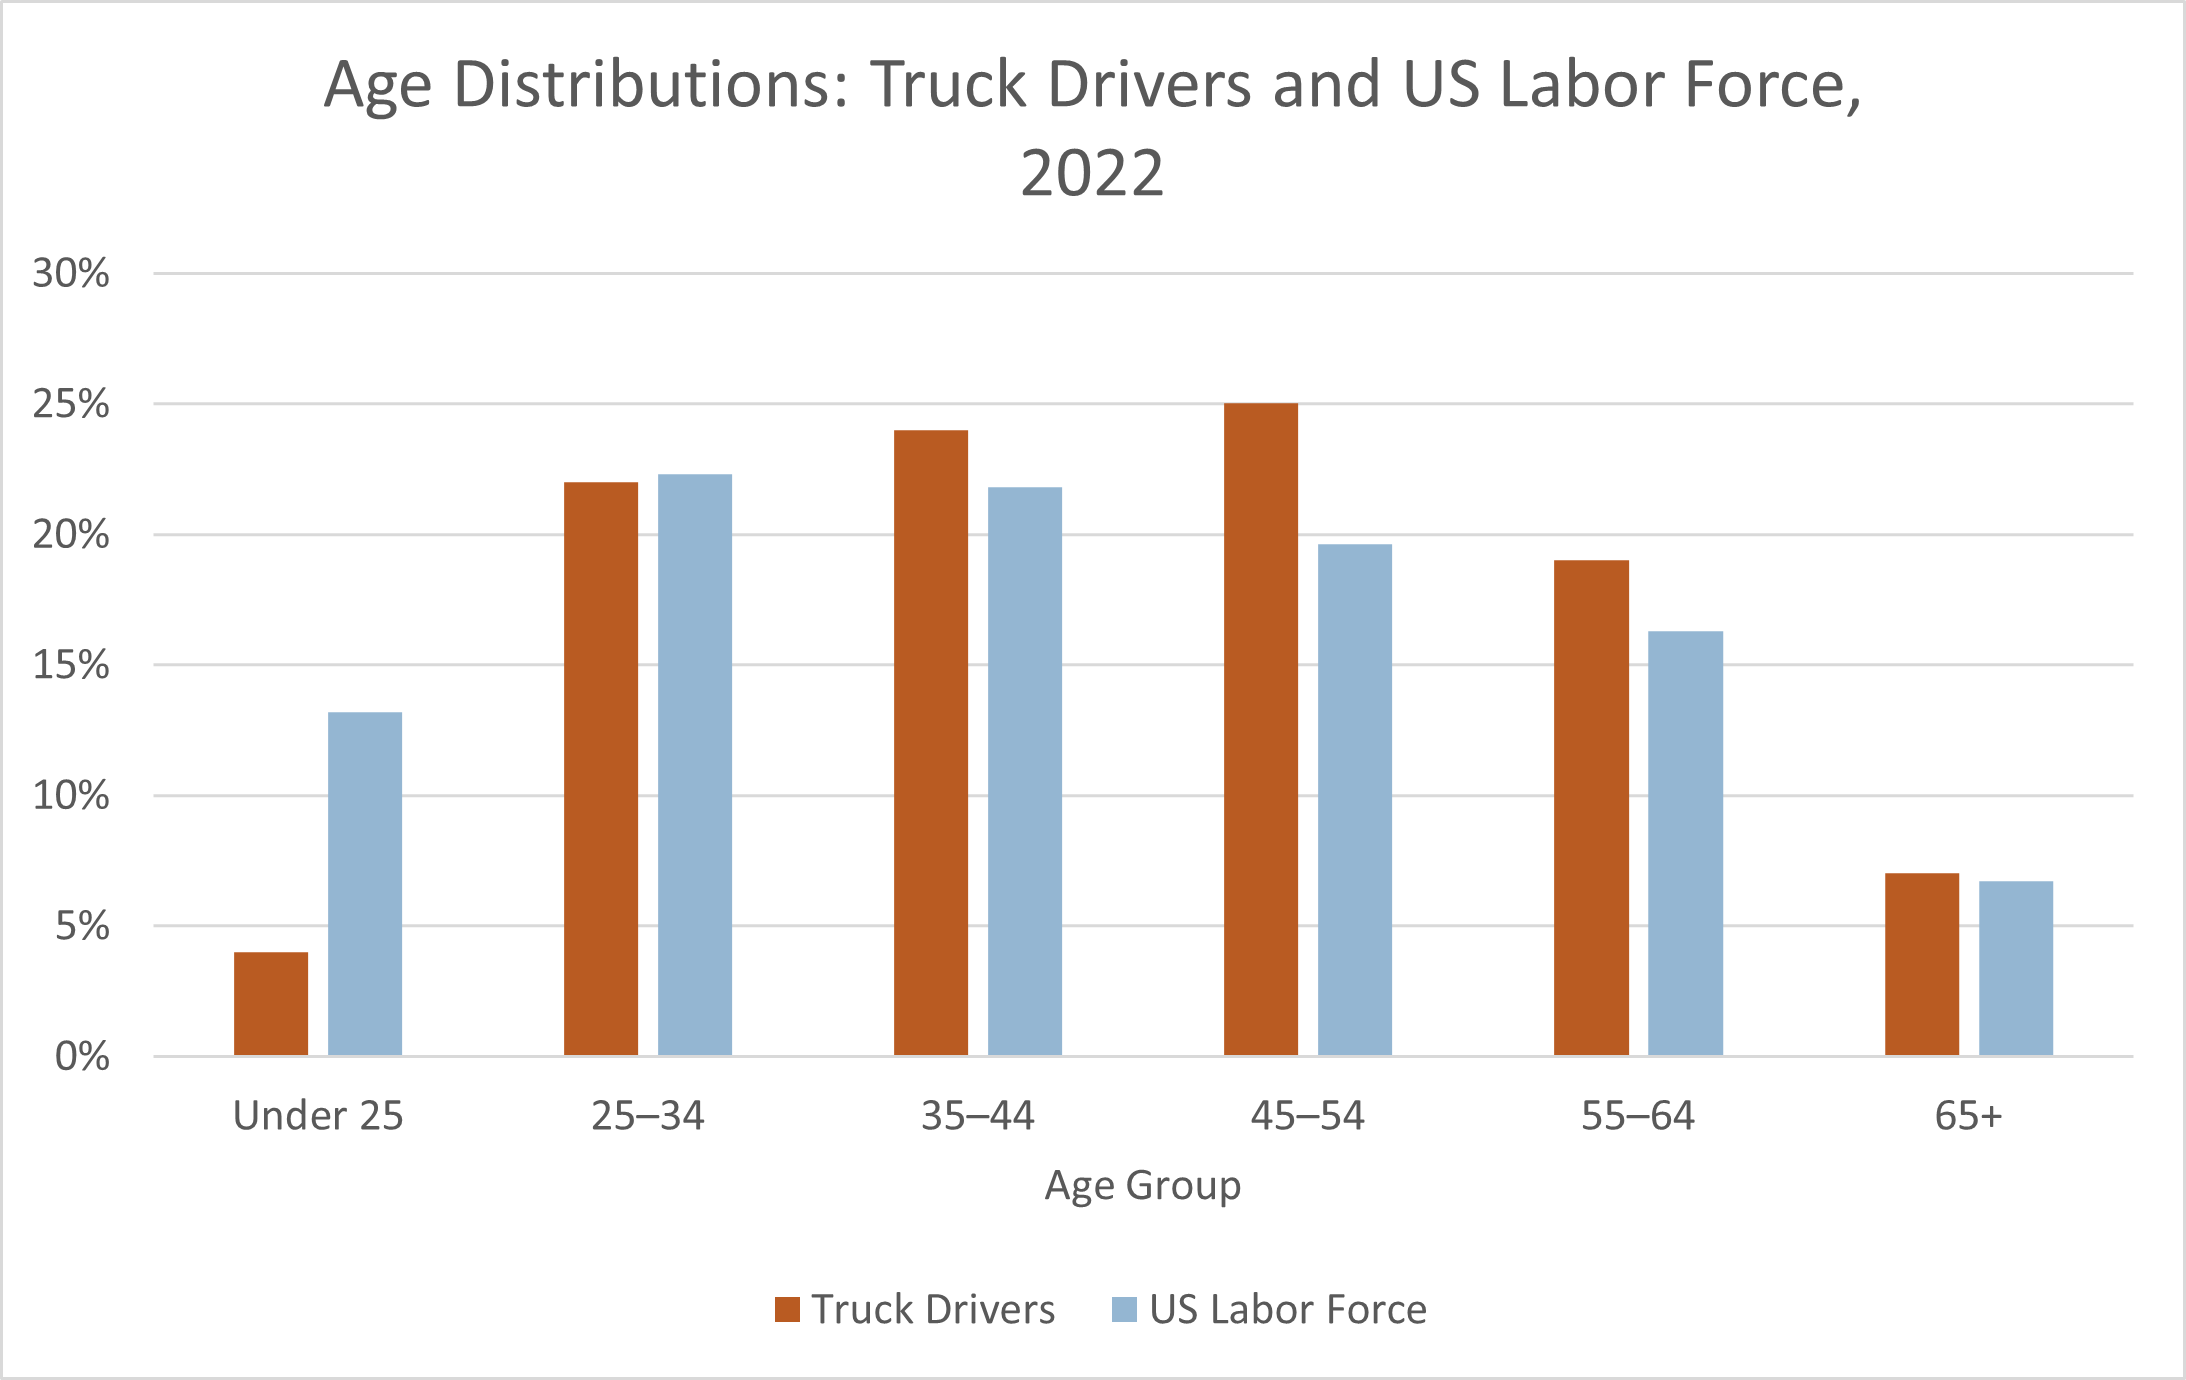
- Commercial drivers skew older than the US workforce generally. Persons aged 20 to 24 make up 9.1% of the US workforce but only 3.1% of drivers holding commercial driver’s licenses (CDLs).
- In recent years, the average age of a truck driver has remained rather stable at about 46 years of age, which has also been the average age of a semi-truck driver specifically. In contrast, the median age of the total US workforce is about 41. Compared with the US workforce, persons aged 20–24 are underrepresented among truckers, and persons aged 55–64 are overrepresented. See the following chart. (Bureau of Labor Statistics, December 2024 and February 2025; NATSO, October 2024)
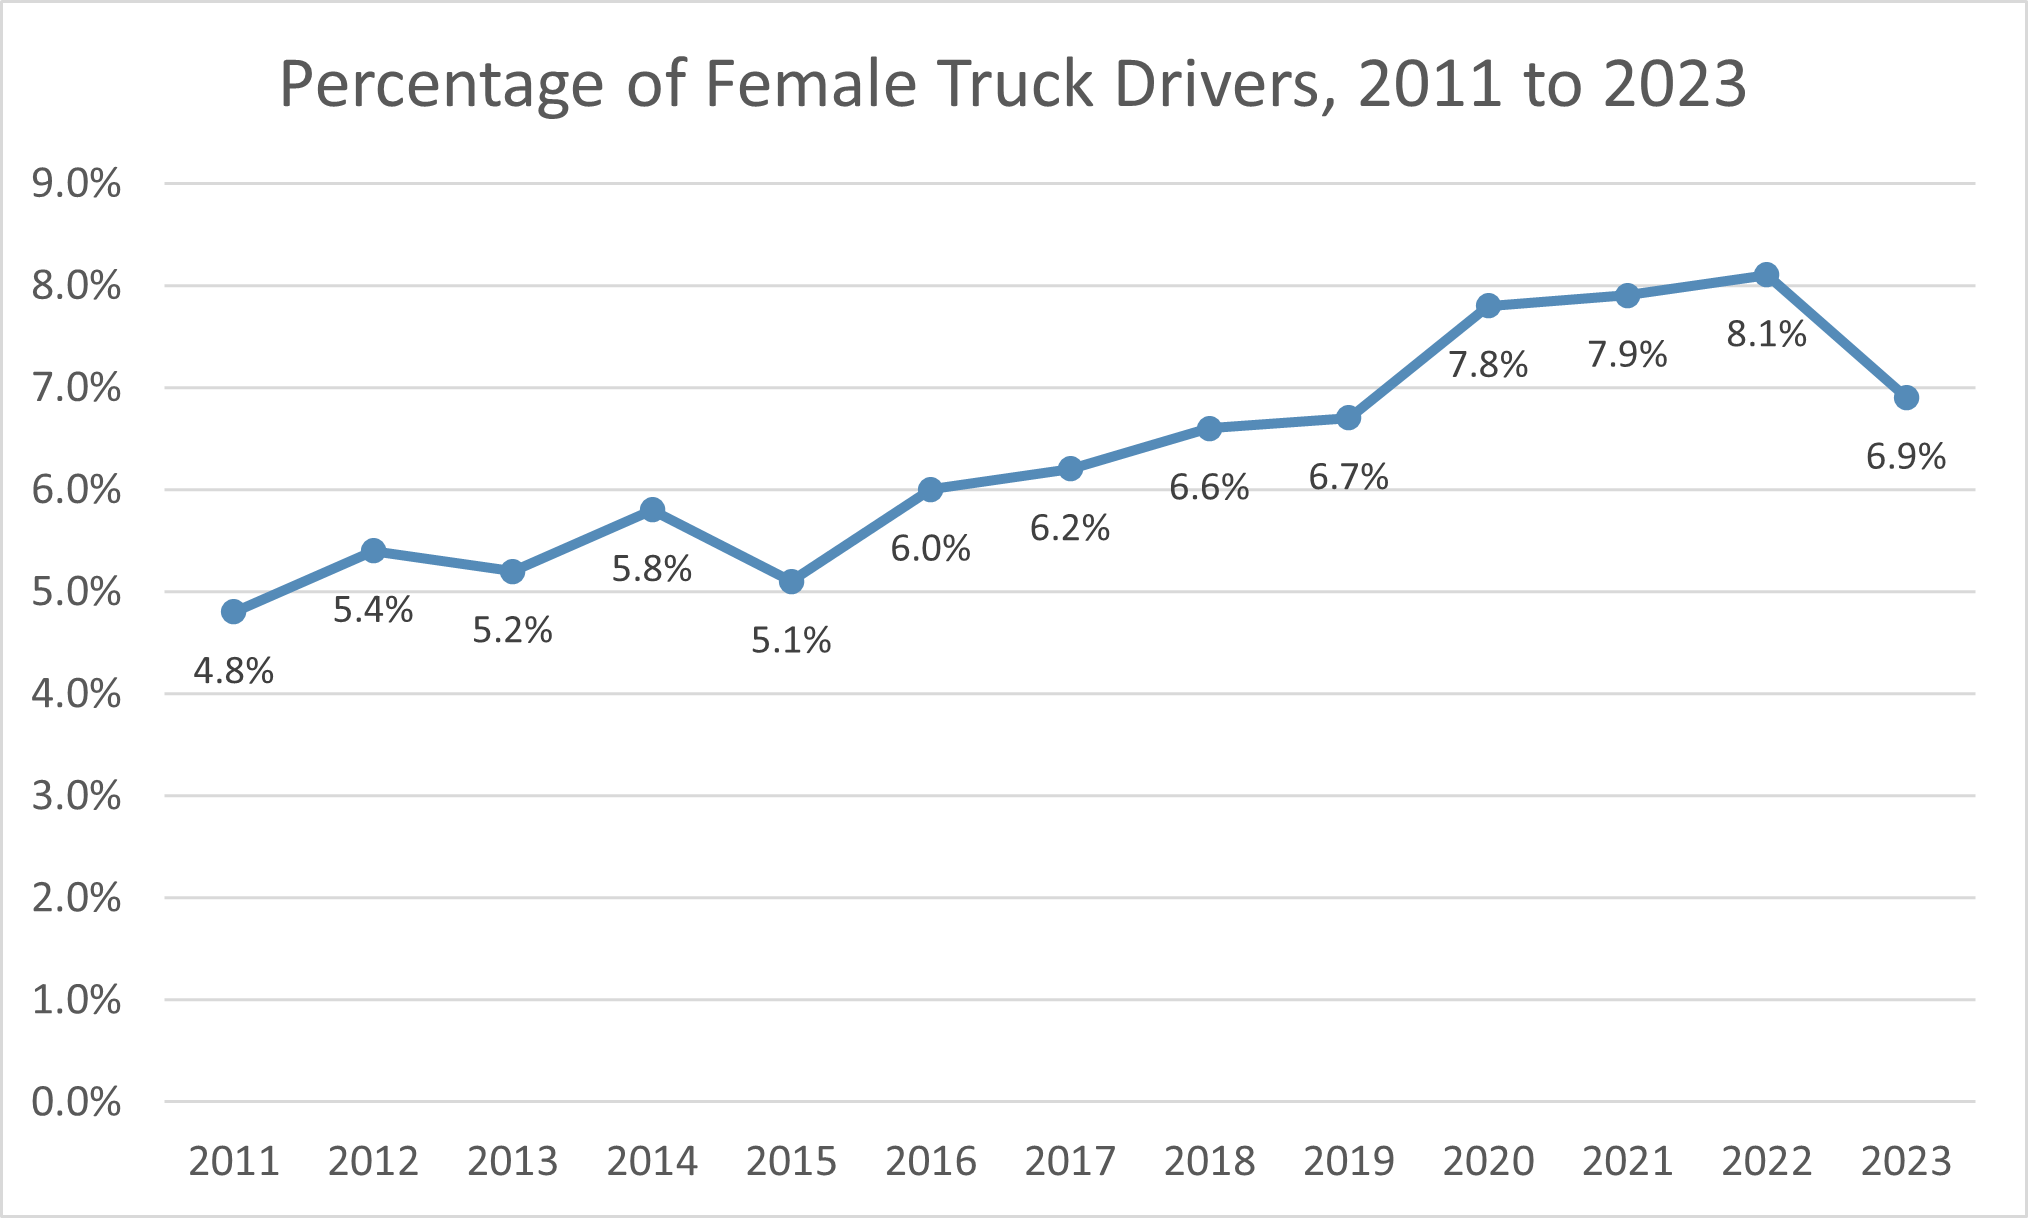
- Estimates of the percentage of truck drivers who are women have varied widely, depending on the criteria for determining what constitutes a “truck” and who should be counted as a “truck driver.” (However, there is now general agreement within government and industry that for estimating the size of the female trucker workforce, Class C CDL holders should not be counted as “truck drivers.”) The following chart is based on figures from the Bureau of Labor Statistics. It indicates a general uptrend in the percentage of truckers who are women, from 4.8% in 2011 to a peak of 8.1% in 2022 before falling off to 6.9% in 2023. In comparison, the general US workforce is about 47% female. (American Transportation Research Institute, June 2024)
- Only 2.6–3.2% of tractor-trailer drivers (holding Class A CDLs) are women. On the other hand, about 15% of Class B CDL holders are women because so many bus drivers are female. Women comprise 45.4% of the bus driver workforce and 53.5% – more than half – of school bus drivers. (American Transportation Research Institute, June 2024; and Data USA, accessed May 2025)
- In 2021, about 18% of employed truck drivers were immigrants, up from 15.7% in 2012. (NATSO, October 2024)
- As of May 2022, there were approximately 141,350 coach and transit bus drivers and 366,550 school bus drivers employed in the United States. (Bureau of Labor Statistics, January 2024)
- Bus drivers tend to be significantly older than the general workforce. In 2023, the average age of bus drivers was 57. This was also the average age of school bus drivers. In comparison, the median age of the total US workforce is 41. (Zippia, January 2024)
- In 2023, 48.9% of bus drivers were female; 51.1% were male. (Zippia, January 2024)
- In 2023, 67.1% of bus drivers were White, 15.3% were Hispanic or Latino, 9.1% were Black, and the rest were other or unknown. (Zippia, January 2024)
- In 2023, 55.3% of school bus drivers were female; 44.7% were male. (Zippia, January 2024)
- In 2023, 69.1% of school bus drivers were White, 14.6% were Hispanic or Latino, 8.1% were Black, and the rest were other or unknown. (Zippia, January 2024)
- In 2023, there were over 48,400 taxi drivers employed in the United States, of whom 79.0% were male and 21.0% were female. The average age of taxi drivers was 47. (Zippia, January 2024)
- In 2023, 52.0% of taxi drivers were White, 23.1% were Hispanic or Latino, 11.1% were Asian, and 7.5% were Black. (Zippia, January 2024)
- In 2022, there were over 1.7 million rideshare drivers in the United States. Uber had roughly one million rideshare drivers, and Lyft had about 700,000. (Zippia, June 2022)
- In 2024, the typical U.S. driver lost about 43 hours to traffic congestion (equivalent to one full-time work week), which amounted to $771 worth of time lost. Congestion cost the nation over $74 billion, up 1.7% from 2023. This may reflect the 8% decline in telecommuting over that year. (INRIA, January 2025)
- A 2021 study found that truck congestion resulted in 1.27 billion hours of delay, the equivalent of more than 460,000 truck drivers remaining idle for one year. It also cost the trucking industry 6.793 billion gallons of wasted fuel. (American Transportation Research Institute, 2023)
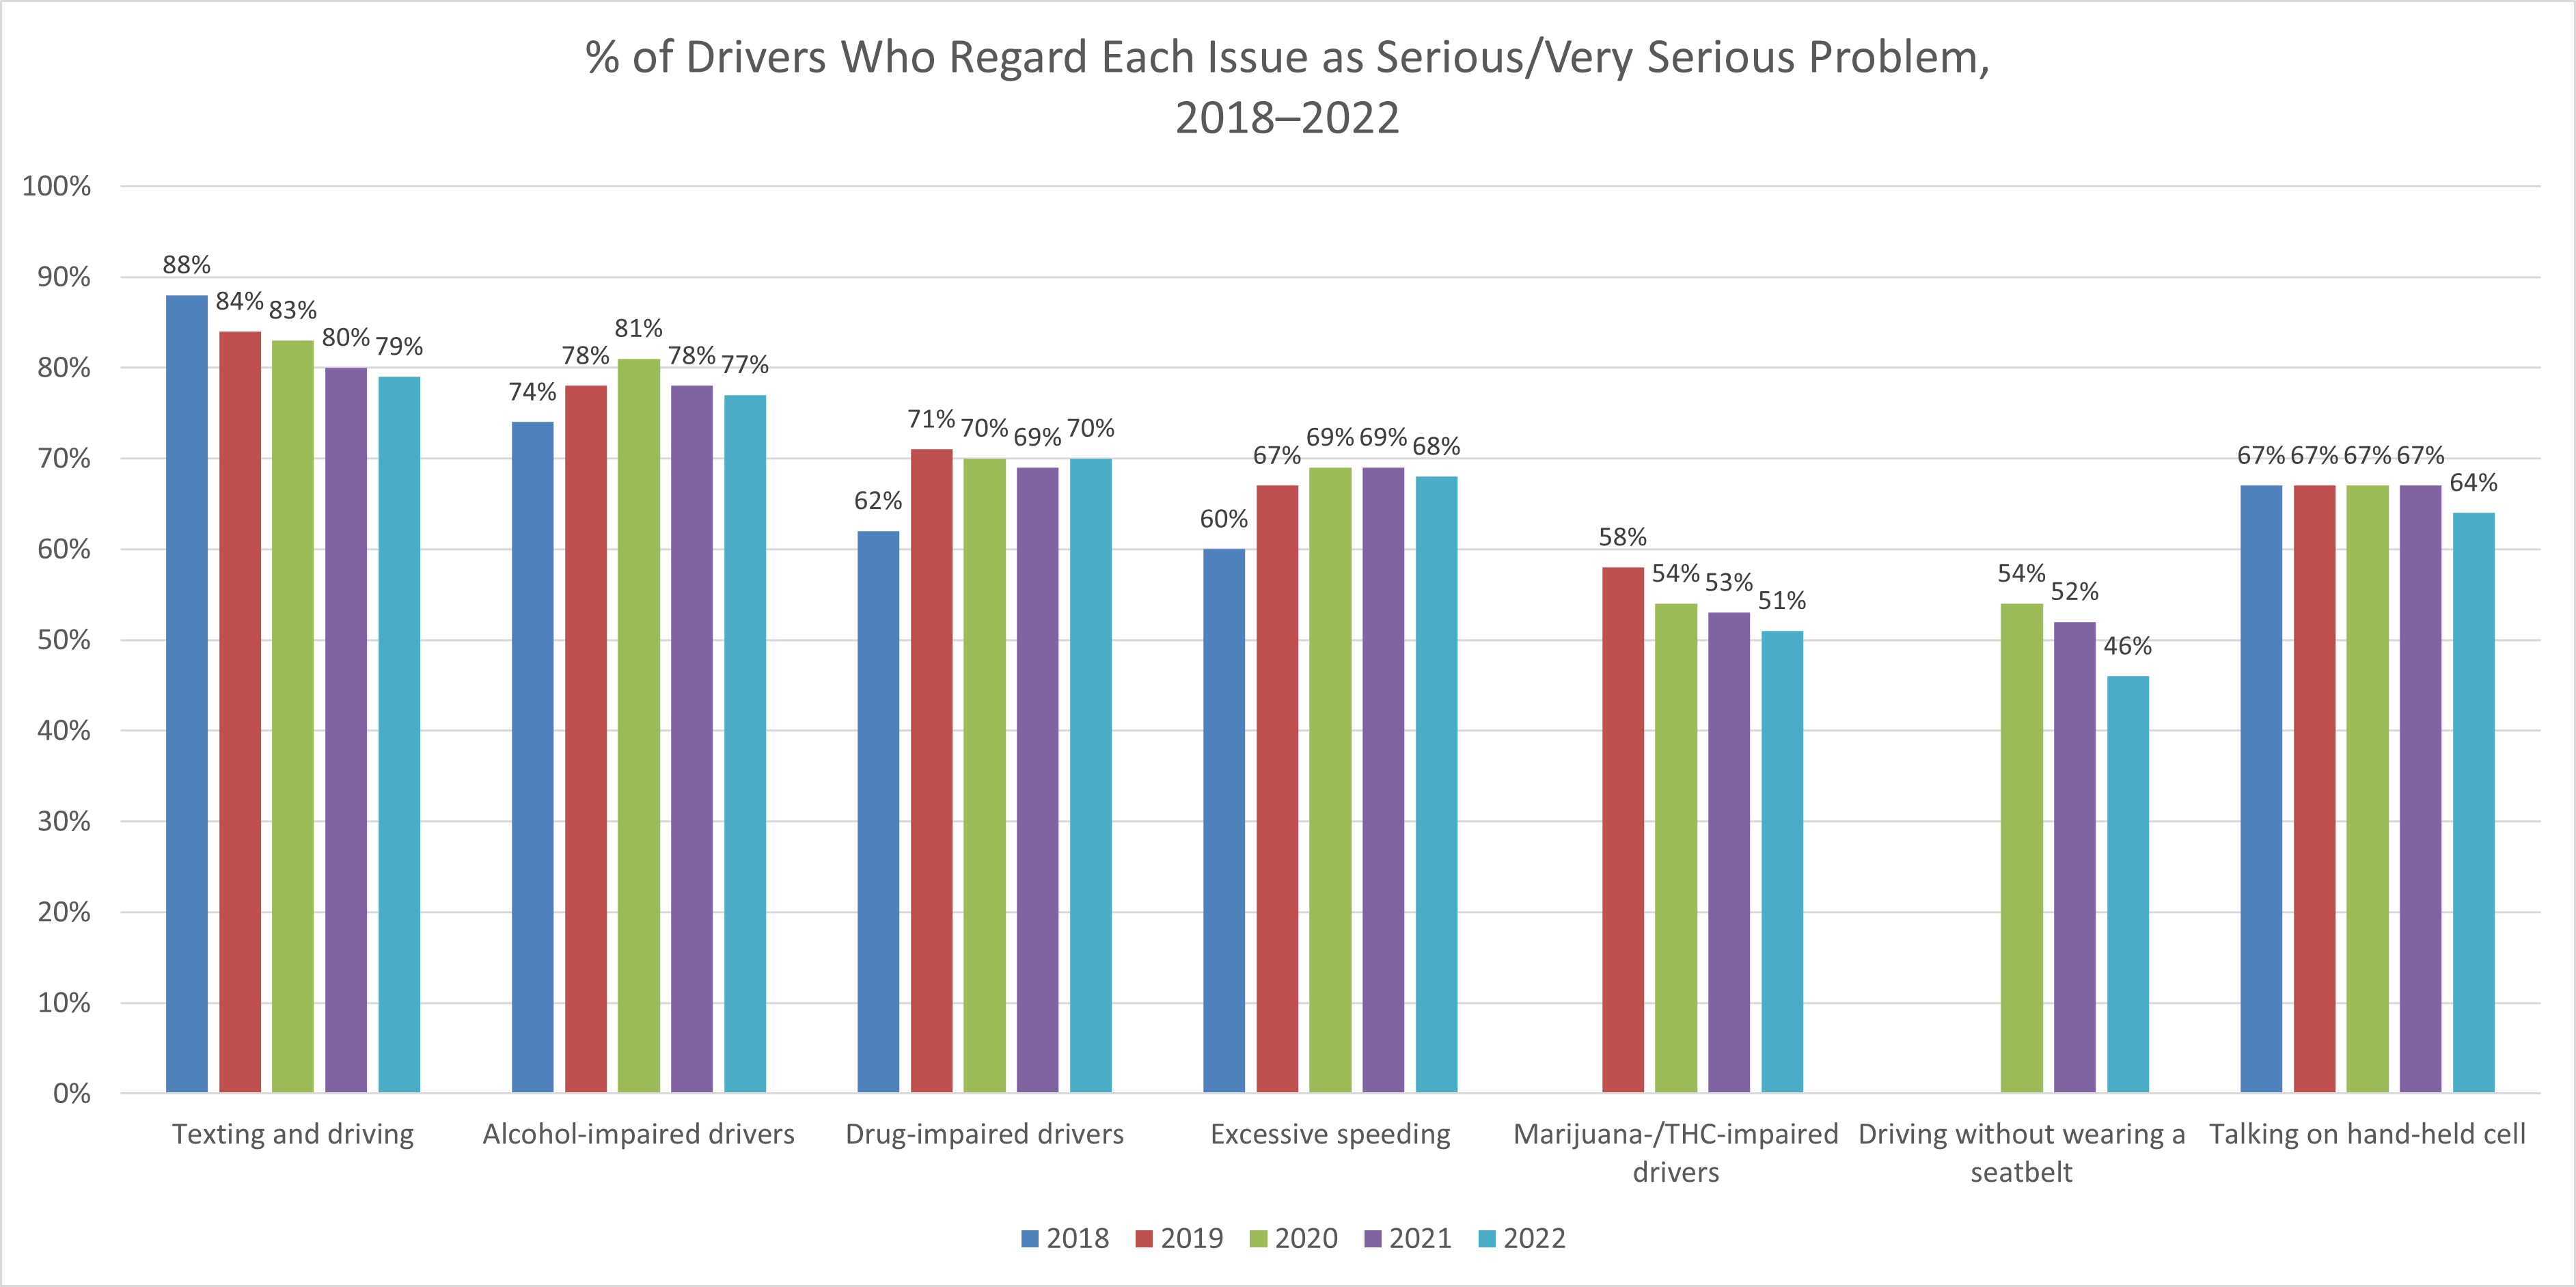
- The Traffic Injury Research Foundation USA (TIRF-USA) surveyed American drivers annually on their level of concern about various driving-related issues. In 2022, 79% of drivers regarded texting while driving as a serious or very serious problem, down a bit from 2018 when 88% were seriously concerned about it. Second only to this issue in perceived seriousness was alcohol-impaired driving: in 2022, 77% of drivers considered it a serious or very serious problem. On the other hand, just 51% of drivers considered driving impaired by marijuana or tetrahydrocannabinol (THC) a serious problem. See the following chart. (TIRF-USA, January 2023)
- In a 2023 survey of 2,700 licensed drivers, 93% of the drivers believed that texting or emailing while driving was highly dangerous, and 78% of the drivers believed that talking on a hand-held cell phone was highly dangerous. However, only 16% of the drivers believed that talking on a hands-free cell phone was highly dangerous, and 15% of the drivers believed that using a hands-free cell phone wasn’t dangerous at all. (AAA Foundation for Traffic Safety, December 2024)
- In that same survey, 89% of the drivers believed that aggressive driving (such as tailgating) was highly dangerous, and 81% of the drivers believed that running a red light was highly dangerous. However, only 61% of the drivers believed that driving at 10 mph over the speed limit in a residential neighborhood was highly dangerous, and only 49% of the drivers believed that driving at 15 mph over the speed limit on a freeway was highly dangerous. (AAA Foundation for Traffic Safety, December 2024)
- In that same survey, 96% of the drivers believed that driving while drowsy was highly dangerous, and 95% believed that driving with a blood alcohol concentration (BAC) over the legal limit was highly dangerous. 88% of the drivers believed that driving after using potentially impairing prescription drugs was highly dangerous. However, only 70% of the drivers believed that driving within an hour after using marijuana was highly dangerous. 3.6% of the drivers believed that this behavior wasn’t dangerous at all. Finally, 76% of the drivers believed that driving without wearing a seatbelt was highly dangerous. (AAA Foundation for Traffic Safety, December 2024)
- A survey of 3,906 truck drivers who took a Holland Codes career test found certain personality traits most common among truck drivers: These truck drivers tended to be realistic (i.e., working outdoors with their hands) and conventional (detail-oriented and organized). They also scored highly on extraversion (they relied on external stimuli to be happy) and openness (they were usually curious and imaginative and valued variety). On the other hand, they tended not to be comfortable in social situations, and they scored fairly low on conscientiousness (they preferred working in structured situations and had more trouble with spontaneous or unexpected situations). (CareerExplorer, accessed April 2025)
- An online survey of 2,097 truck drivers in August–September 2021 examined the motivating factors behind each respondent’s choice of becoming a Company Driver or an owner-operator/independent carrier (OO/IC), as well as the current level of driver satisfaction with each factor.
- Among Company Drivers, the top three motivating factors were Job Security/Stability (88.5%), Income (83.1%), and Healthcare/Retirement Savings (79.1%). However, only 59.5% of Company Drivers reported being satisfied with their Healthcare/Retirement Savings. Among female Company Drivers, 84.3% indicated Healthcare/Retirement Savings was an important motivating factor for becoming a Company Driver, and 68.6% of female drivers reported being satisfied with Healthcare/Retirement Savings.
- Among OO/ICs, the top three motivating factors were Independence/Ability to Set Hours (94.8%), Schedule/Flexibility (93.6%), and Choice of Routes/Length of Haul (91.3%). In contrast with Company Drivers, only 39.2% of OO/ICs rated Healthcare/Retirement Savings as a top motivating factor. (American Transportation Research Institute, 2022)
Speeding Statistics
- In 2022, 12,151 traffic fatalities, representing 29% of all traffic crash fatalities, occurred in speed-related crashes. In addition, 300,595 traffic injuries, representing 13% of all traffic crash injuries, occurred in speed-related crashes. Speed-related crashes accounted for 28% of all fatal crashes, 12% of injury crashes, and 8% of property-damage-only crashes. (NHTSA, July 2024; and IIHS, August 2024)
- Among all drivers involved in fatal crashes in 2022, 6% of large-truck drivers, 15% of light-truck drivers, 22% of car drivers, and 35% of motorcycle riders had been speeding. (NHTSA, July 2024)
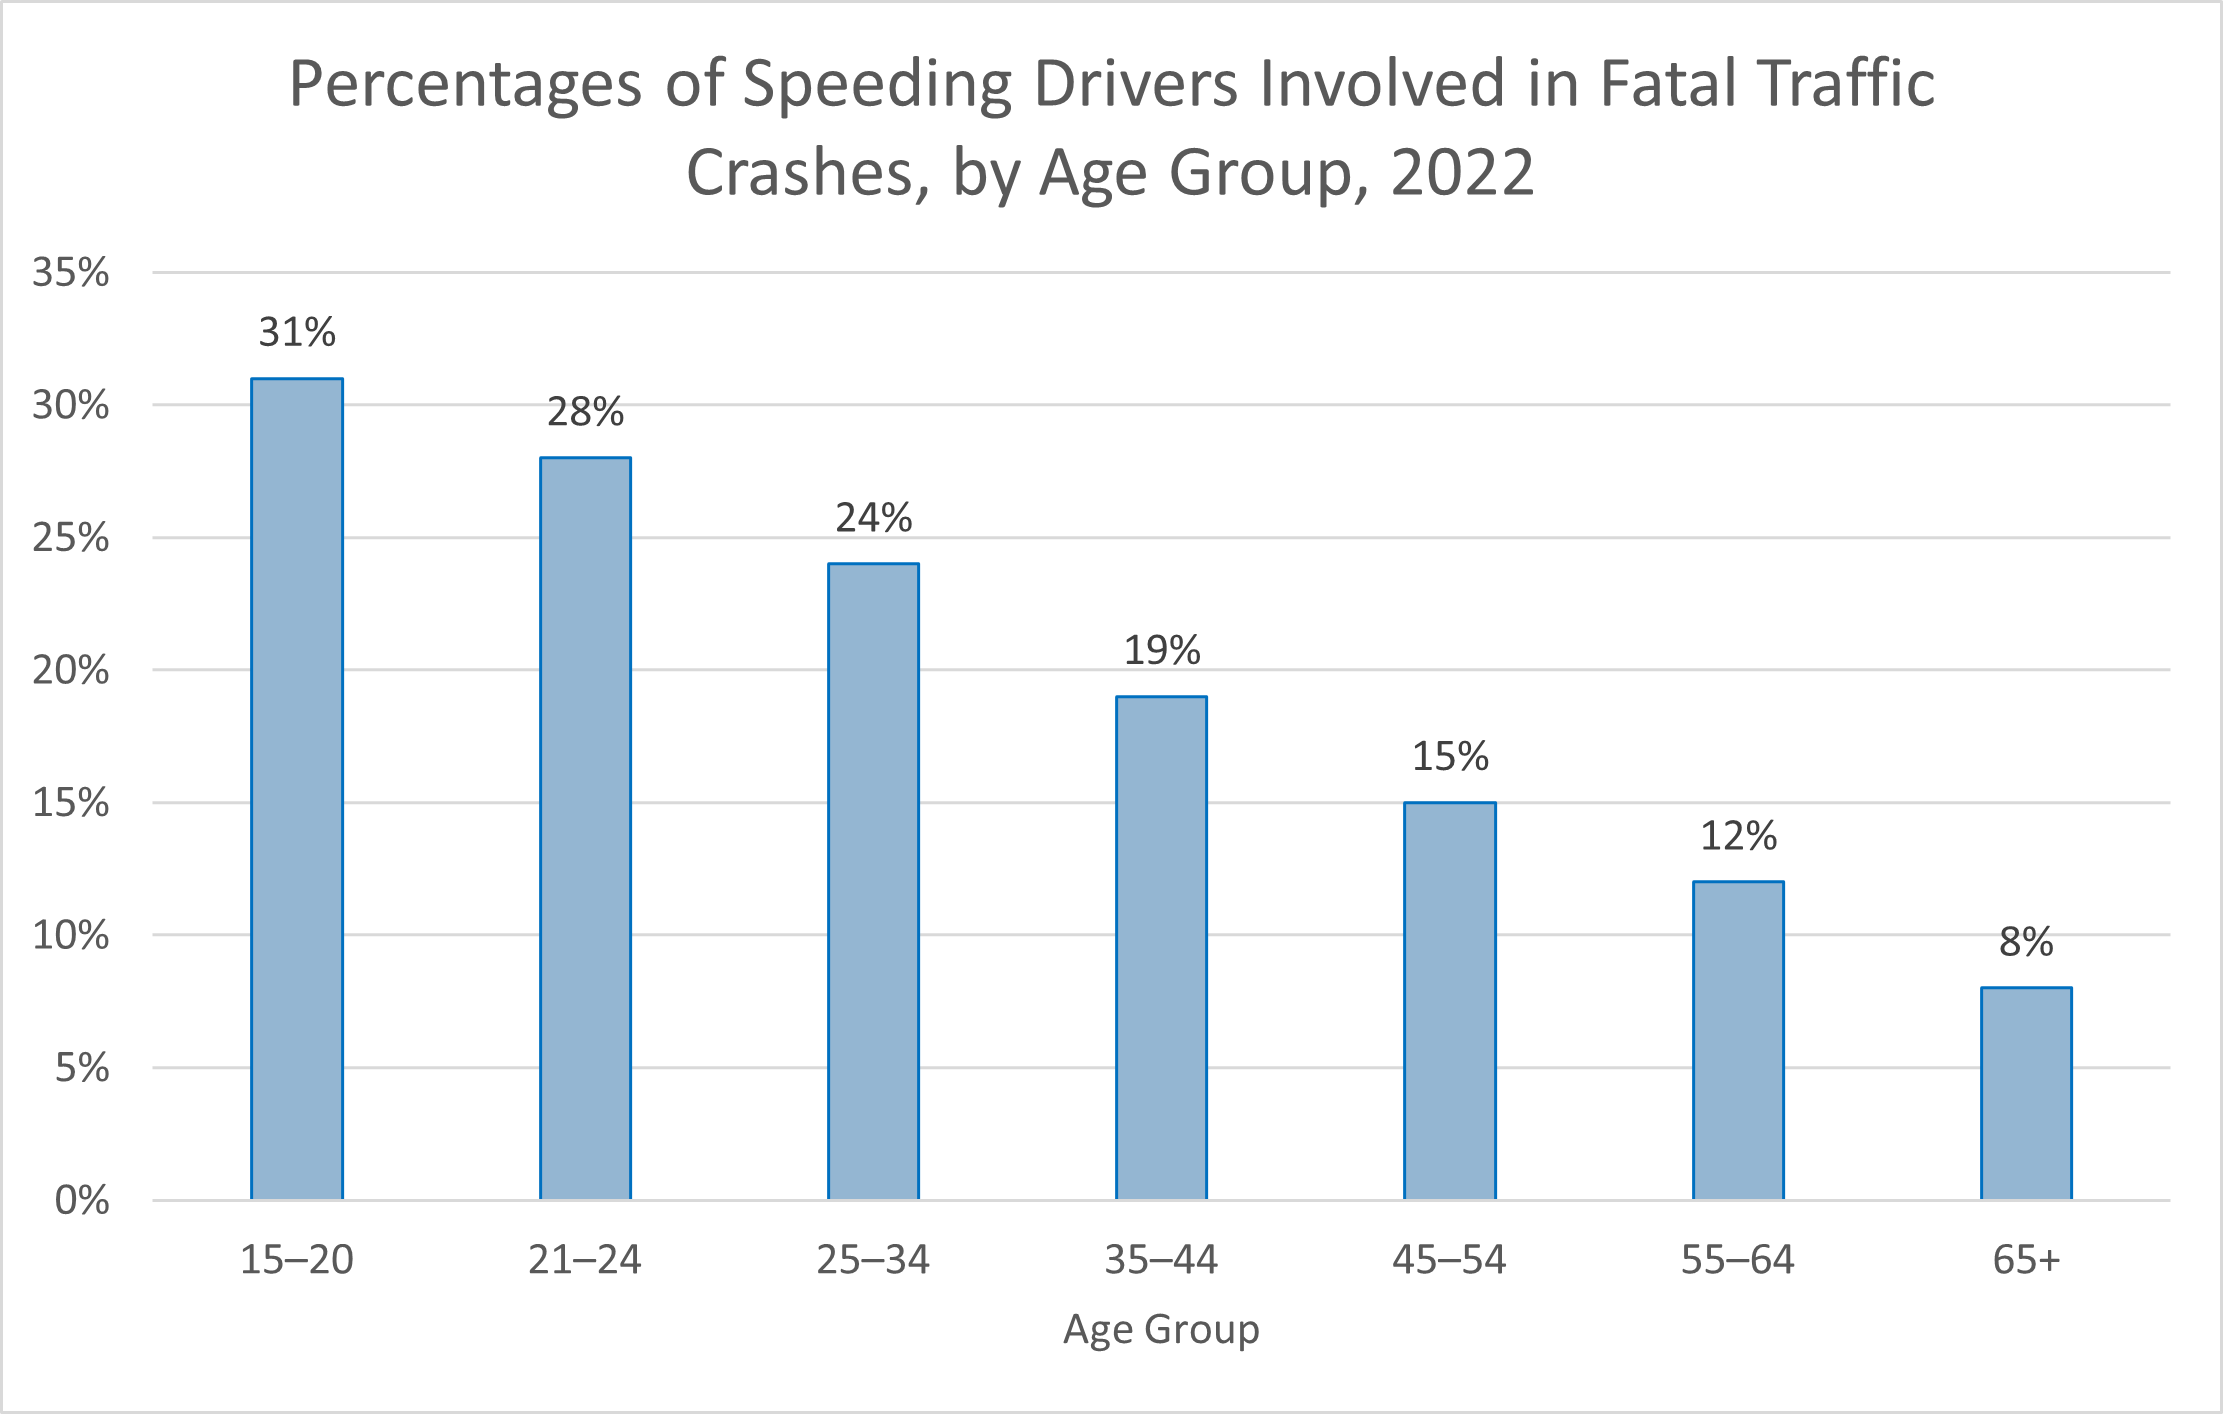
- In 2022, 31% of drivers ages 15–20 who were involved in fatal crashes had been speeding at the time of the crash, the highest percentage among all age groups. Drivers ages 65 and older had the lowest percentage. See the following chart. (NHTSA, July 2024 and August 2024)
- Studies have found that for vehicle collisions with pedestrians, the risk of fatal pedestrian injury increases dramatically with the vehicle’s speed. Over the range 30 km/h (19 mph) to 60 km/h (37 mph), each 10 km/h (6 mph) increase in vehicle speed approximately doubles the risk of fatal pedestrian injury. The risk of an injury or fatal collision likewise increases dramatically with the vehicle’s speed and can be modeled as a power curve or an exponential curve. (International Transport Forum, accessed April 2025)
- In 2022, 35% of male drivers and 21% of female drivers aged 15–20 who were involved in fatal traffic crashes had been speeding, the highest among the age groups. This compares with only 8% of male drivers 75 or older and 5% of female drivers 75 or older. (NHTSA, July 2024)
- In 2022, 29% of speeding drivers involved in fatal traffic crashes did not have a valid driver’s license at the time of the crash, compared with 15% of non-speeding drivers. (NHTSA, July 2024)
- In 2022, 35% of motorcycle riders involved in fatal traffic crashes had been speeding, compared with 22% of passenger car drivers, 15% of light-truck drivers, and 6% of large-truck drivers. 12% of motorcycle riders involved in fatal traffic crashes had been both speeding and intoxicated (BAC of 0.08% or higher). 11% of motorcycle riders had been speeding without wearing a helmet. (NHTSA, July 2024)
- Among drivers involved in fatal traffic crashes in 2022, 18% of drivers who had been speeding had undergone previous license suspensions or revocations, compared with 10% of non-speeding drivers. (NHTSA, July 2024)
- Among drivers of passenger vehicles in 2022, 52% of speeding drivers involved in fatal traffic crashes were unrestrained (i.e., not wearing seat belts) at the time of the crash, compared with 22% of non-speeding drivers. (NHTSA, July 2024)
- In 2022, 87% of speeding-related traffic fatalities occurred on non-interstate roadways. (NHTSA, July 2024)
- In 2022, there were 821 fatal crashes in work zones. Speeding was a factor in 281 (34%) of these fatal crashes. (FHWA, accessed May 2025).
- As of May 2024, 19 states and Washington, DC have enacted laws that permit the installation of speed cameras to detect violations of speed limits. Nine states have prohibited the installation of speed cameras. (Governors Highway Safety Association, May 2024)
Driving Ability Statistics
- A survey of 2,000 adult American drivers in 2024 found that only 40% were sure they remembered and followed all the safety precautions they were taught as student drivers. They also had trouble identifying various dashboard indicators. 79% of these drivers could correctly identify the oil pressure warning light on the dashboard, and 64% could identify the check engine light. However, despite having owned their cars for an average of five years, only 51% of the drivers could correctly identify the temperature warning light, and only 47% could identify the tire pressure warning light. Furthermore, only 22% correctly identified the transmission temperature warning light, and another 23% confused it with the temperature warning light. 15% percent of the drivers surveyed admitted they had never read their vehicle’s owner’s manual. (LIQUI MOLY and Talker Research, October 2024)
- Certain driving abilities tend to decline naturally with advancing age. Nevertheless, older Americans are still driving well into their eighties nowadays. In 2023, 70.6% of Americans ages 85 and older (88.3% of males, 60.3% of females) were still driving. Also, drivers ages 85 and older made up 1.8% of all drivers. Male drivers ages 85 and older made up 1.7% of all male drivers, and female drivers ages 85 and older made up 2.0% of all female drivers. (Federal Highway Administration, December 2024)
Accident Statistics
- In 2022, there were 5,930,496 police-reported motor vehicle crashes, including 39,221 crashes involving death, 1,664,598 crashes involving injury, and 4,226,677 crashes involving property damage only. This works out to about 1,014 injured persons and 18 fatalities per 100,000 licensed drivers. (NHTSA, August 2024)
- A typical passenger vehicle driver files a vehicle insurance claim for a traffic accident an average of once every 17.9 years. (Isaacs & Isaccs, accessed April 2025)
- Based on 2022 data, the National Safety Council estimated that a driver’s average lifetime risk of dying in a traffic crash is about 1 in 93 (1.08%).
- In 2022, there were approximately 575,000 crashes involving large trucks and 50,000 crashes involving buses. (Note that thousands of crashes involved both a truck and a bus.) (FMCSA, December 2024)
- The economic cost of traffic crashes in 2019 was estimated to be about $340 billion. This was equivalent to 1.6% of the $21.4 trillion real US GDP in 2019. When lost quality of life (such as permanent disability or permanent physical pain for many of the injured) was included, the total cost to society was estimated at about $1.37 trillion. This was equivalent to 6.4% of real US GDP in 2019. (NHTSA, February 2023)
- The percentages of societal cost (including both direct economic cost and quality-of-life cost) caused by each of the following factors were distracted driving (29%), driving under the influence (DUI) (21%), and speeding or driving too fast for conditions (16%). (NHTSA, February 2023)
- In 2022, passenger cars and light trucks made up 92% of registered vehicles and 76% of the vehicles involved in fatal traffic crashes. (NHTSA, September 2024)
- Around 3 million people are injured in car accidents every year, and about 2 million of them have claimed to have suffered permanent injuries. (However, these injuries and their severity are self-reported.) (Tario & Associates, accessed April 2025) A more objective, peer-reviewed study found that about 10% of all vehicle occupants who survived crashes with even minor injuries (such as whiplash, soft tissue damage, or joint sprains) sustain permanent medical impairments. (Association for the Advancement of Automotive Medicine, 2008)
- Nationwide, 43% of first-year drivers and 37% of second-year drivers are involved in car crashes. (Safety Insurance, accessed April 2025) The risk of a crash is highest by far during the first three months that a driver is licensed to drive unsupervised. (National Institutes of Health, 2018)
- Out of nearly six million vehicular crashes that occur every year in the United States, approximately 21% are weather-related. (FHWA, September 2024)
- Rear-end collisions are the most frequently occurring type of traffic crash. In 2022, for example, about 28.4% of traffic crashes were rear-end collisions. Over 20% of all car accidents involved rear-end collisions caused by tailgating. The next most common type of crash was the angle (“T-bone”) collision, accounting for approximately 22.7% of all crashes. (NHTSA, August 2024)
- In 2021, at least one driver-related factor was recorded for 32% of the drivers of large trucks in fatal crashes, compared with 54% of the bus drivers in fatal crashes (FMCSA, November 2023).
- For the drivers of large trucks involved in fatal crashes in 2021, these were the most common driver-related factors: speeding (7.0%), distraction or inattention (4.9%), careless driving (4.7%), failure to yield the right-of-way (4.5%), and impairment (fatigue, alcohol, illness, etc.) (4.2%). (FMCSA, November 2023)
- For bus drivers involved in fatal crashes in 2021, these were the most common driver-related factors: speeding (18.2%), impairment (fatigue, alcohol, illness, etc.) (15.7%), failure to yield the right-of-way (7.9%), careless driving (7.9%), and improper lane usage (7.5%). (FMCSA, November 2023)
- In fatal large truck crashes in 2021, 72.7% of the large truck drivers had a valid commercial driver's license (CDL), 22.5% had no CDL, and 1.6% had a CDL that was expired, suspended, revoked, canceled, or disqualified. The rest were unknown or invalid for other reasons. (FMCSA, November 2023)
- Certain driver performance errors, including committing a right-of-way error (with or without the yield sign), sudden or improper braking or stopping, failure to stop at a stop sign, and being unfamiliar with a vehicle or roadway, increase the risk of crashing by hundreds of times. (Virginia Tech Transportation Institute, 2016)
- A 2021 study of local 911 calls to the Washington, DC police found that about 10% of vehicle-only crashes and 30% of pedestrian and cyclist crashes were not recorded by the police. (Bloomberg CityLab, July 2021)
- In a 2021 survey of 1,757 emergency responders, 248 (14.1%) of them reported being struck by a moving vehicle while they were managing traffic incidents. Of these 248 responders, 81 (32.7%) said they had sustained moderate injuries requiring only outpatient treatment, and 37 (14.9%) said they had sustained injuries serious enough to require hospitalization. (AAA Foundation for Traffic Safety, January 2023)
Aggressive Driving Statistics
- 66% of traffic fatalities are caused by aggressive driving. (SafeMotorist.com, 2019)
- 37% of aggressive driving incidents involve a firearm. (SafeMotorist.com, 2019)
- Over a seven-year period, 218 murders and 12,610 injuries were attributed to road rage. Still, these figures represented only a tiny fraction of all the traffic deaths and traffic injuries that occurred during those years. (SafeMotorist.com, 2023)
- In 2022, 1,149 people were killed and more than 107,000 people were injured in traffic crashes resulting from running red lights. (IIHS, June 2024)
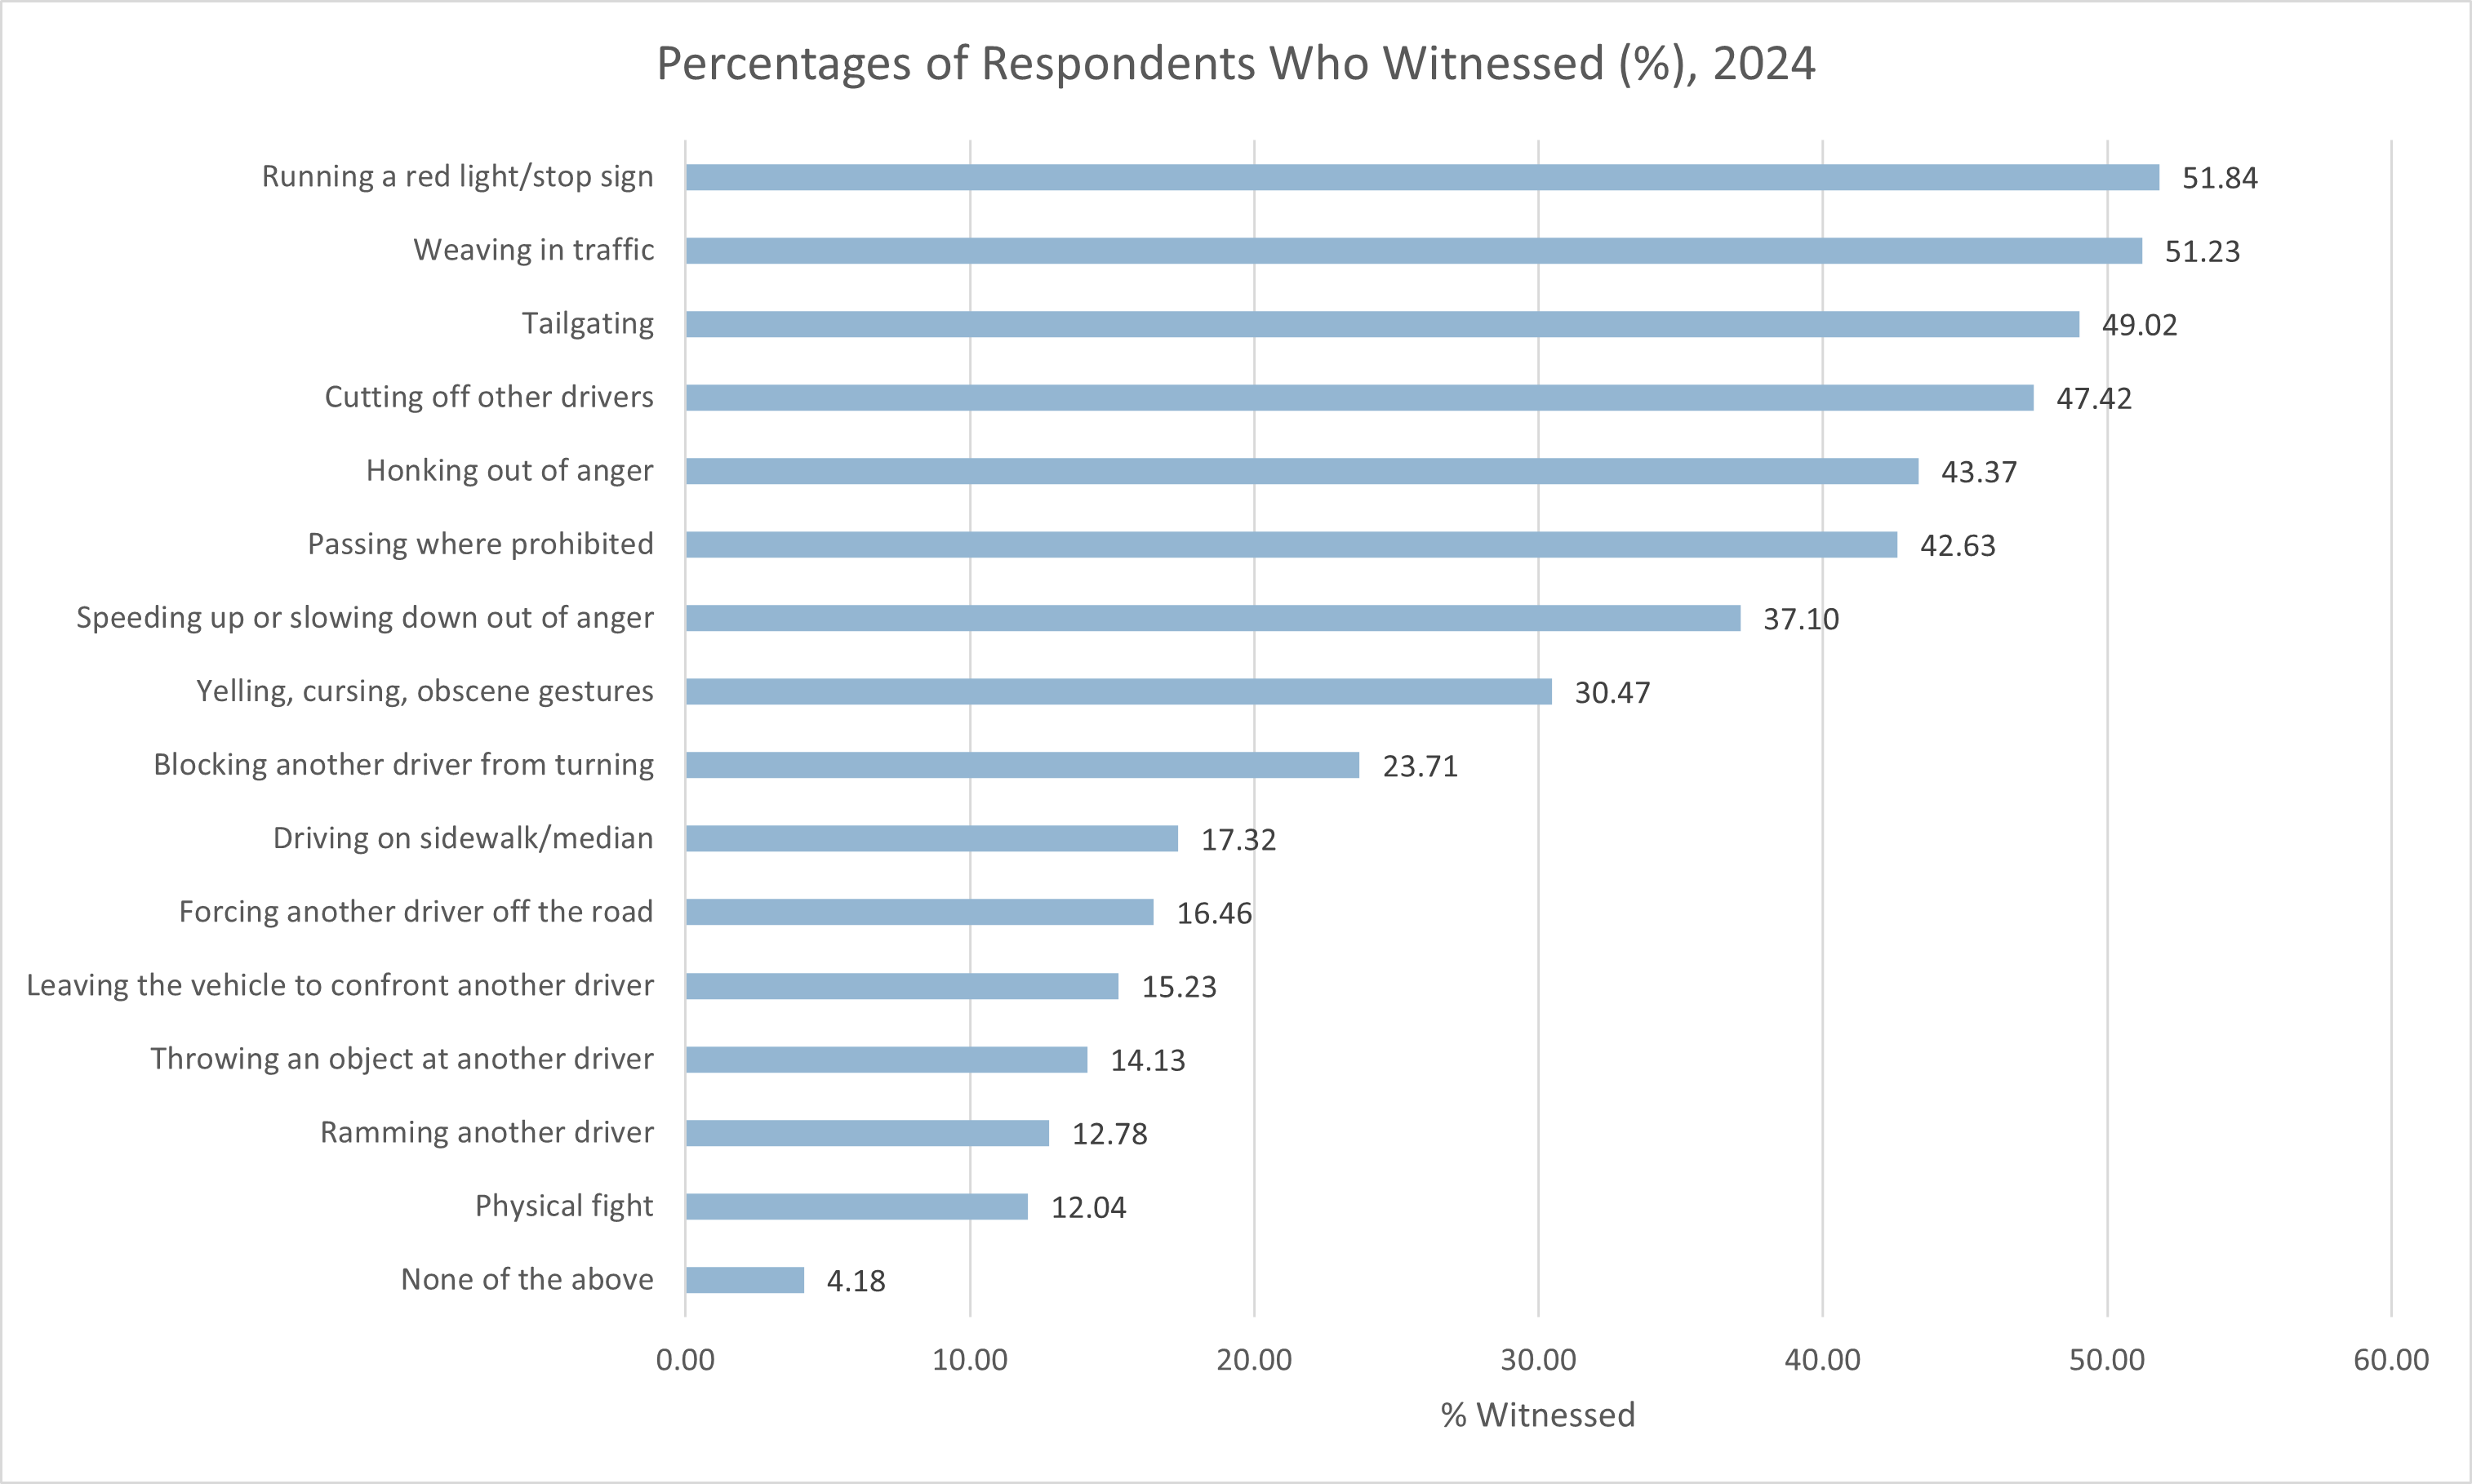
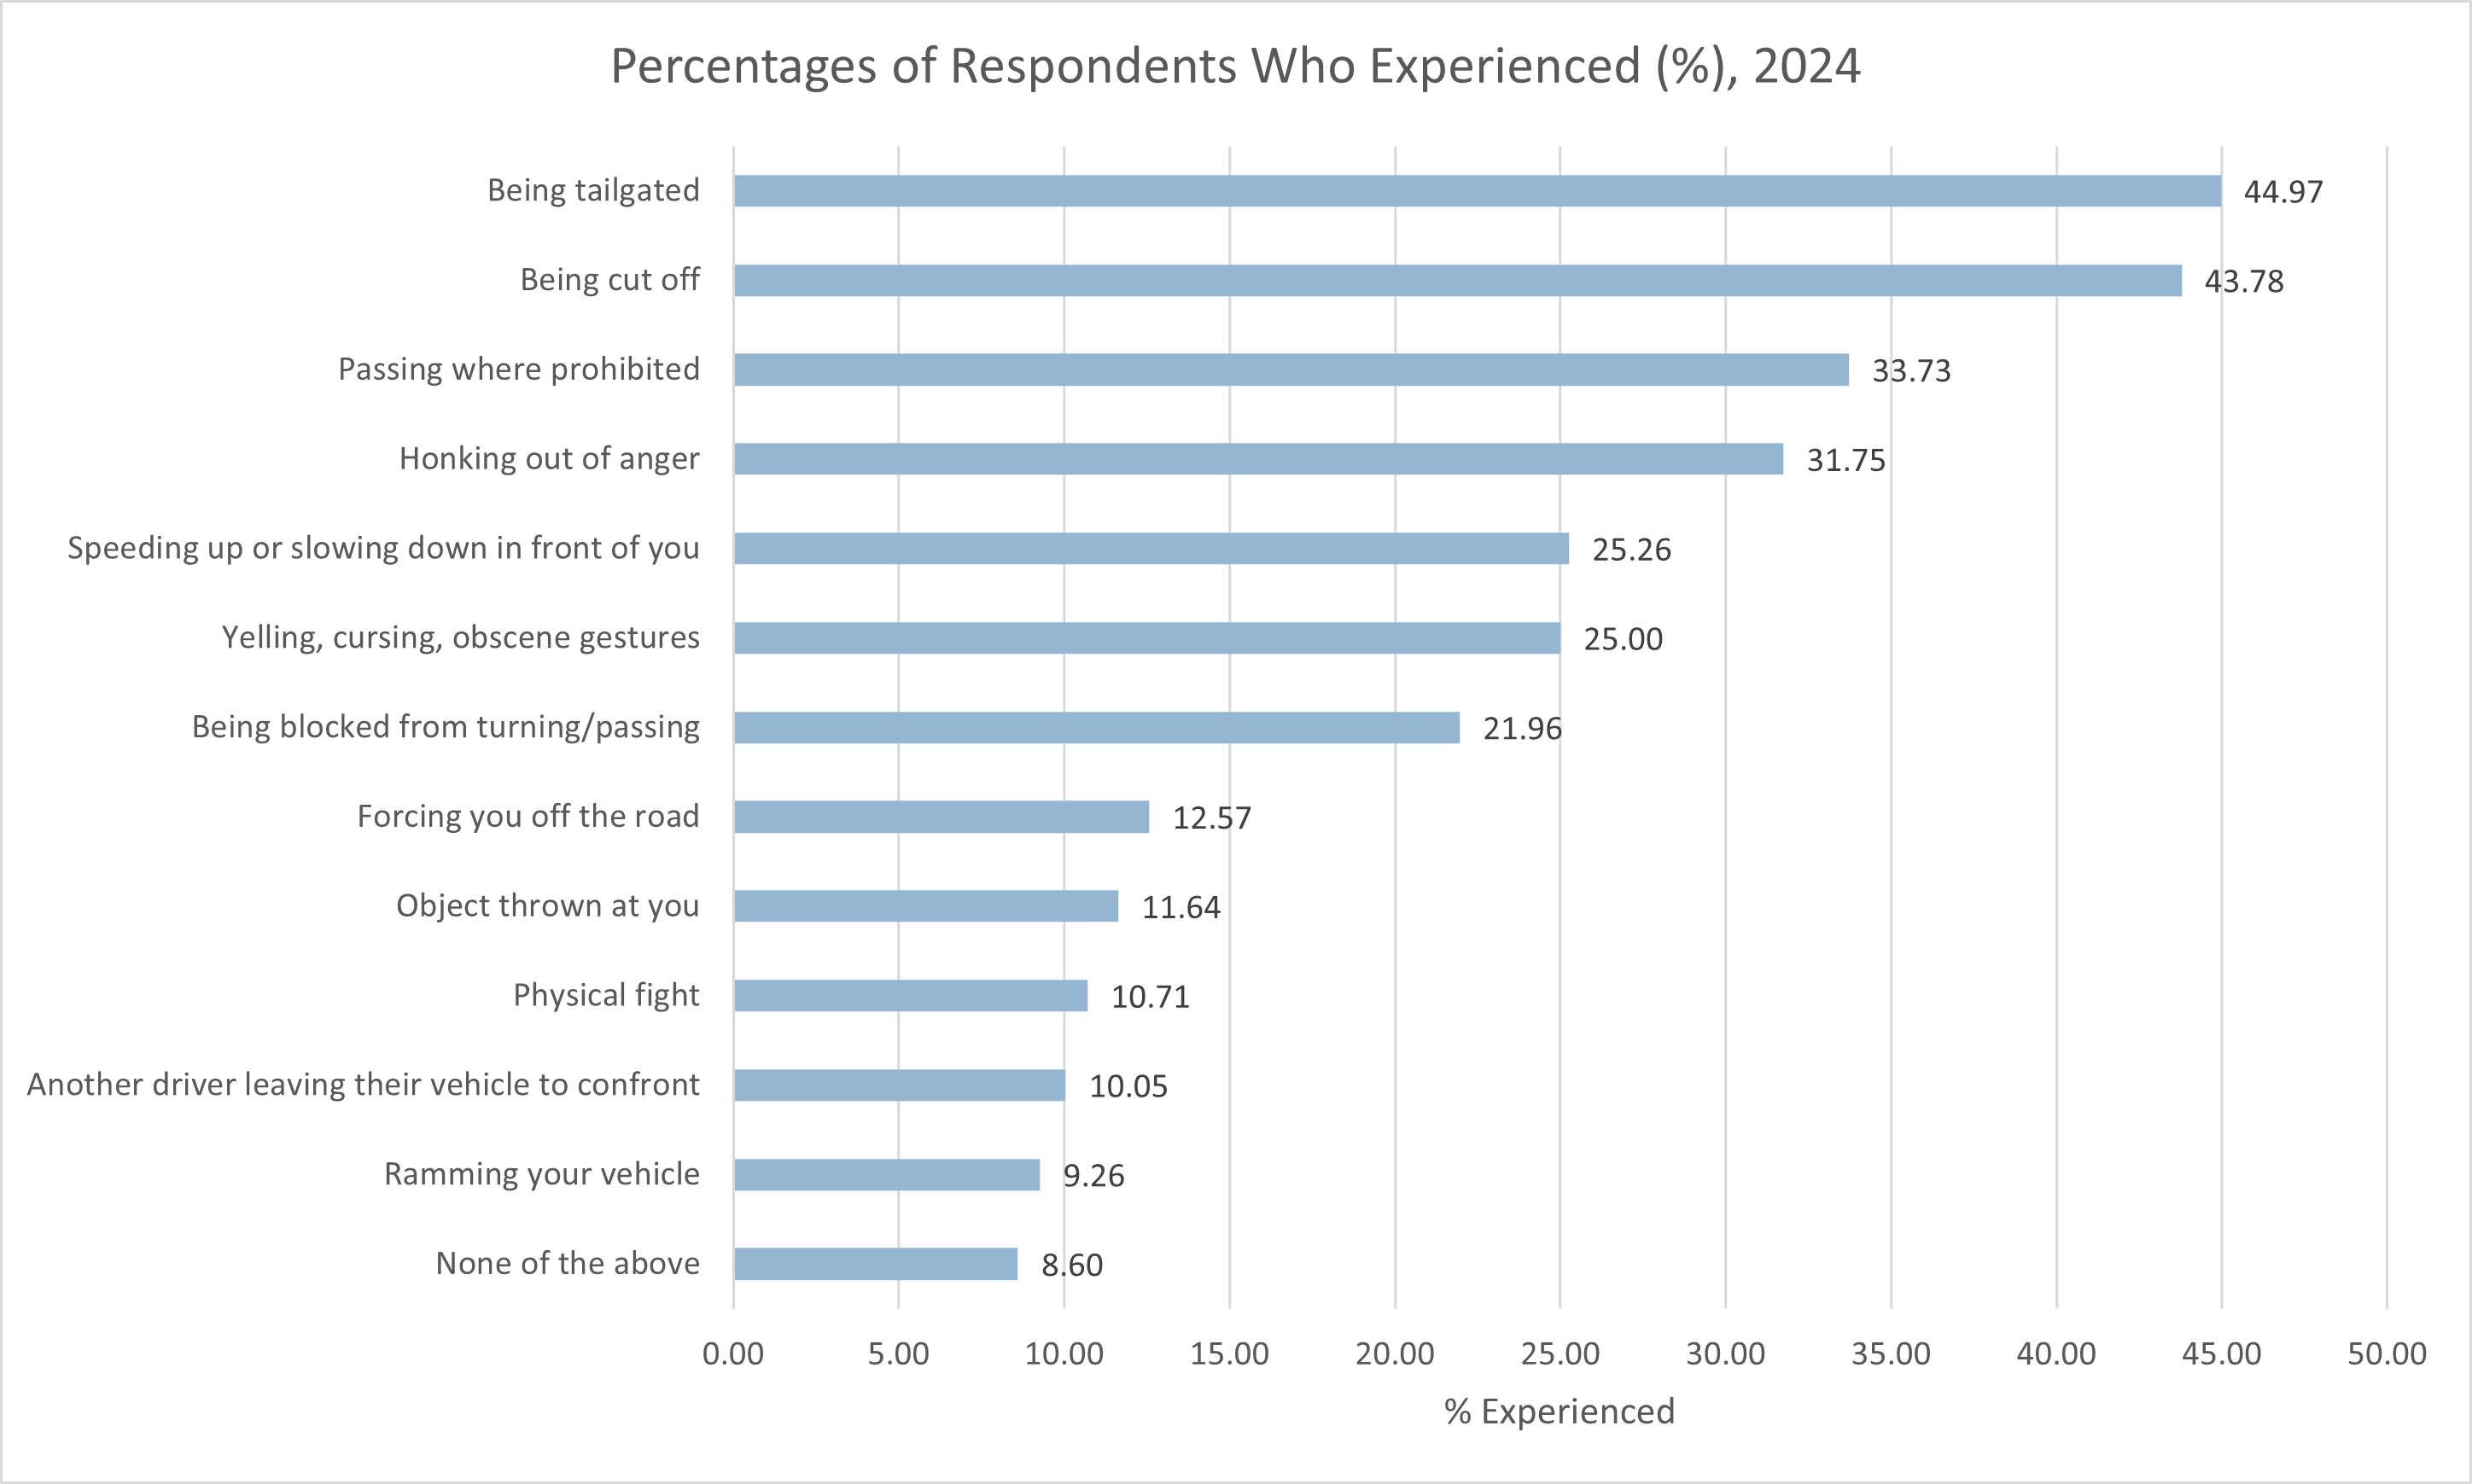
- In a survey of 814 drivers in October 2024, 96% of them reported witnessing other drivers engaging in aggressive driving behaviors in the past six months. The most common one was running a red light or stop sign; 51.84% of respondents reported witnessing that behavior. However, when it came to being on the receiving end of aggressive driving, the most common aggressive behavior was being tailgated; 44.97% of drivers reported being tailgated in the past six months. A disturbing number had also witnessed road rage. 12.78% of the drivers said they had witnessed another driver’s vehicle being rammed, and 9.26% of the drivers reported having been rammed themselves. See the following two charts. (The Zebra, January 2025)
- Half of the drivers who were on the receiving end of aggressive behavior, such as horn honking, a rude gesture, or tailgating admitted to responding with aggressive behavior themselves. (SafeMotorist.com, 2019)
- 2% of drivers admitted to trying to run an aggressor off the road at least once. (SafeMotorist.com, 2019)
- In a 2023 telephone survey of drivers ages 16 and older, 49.2% of them admitted to driving at 15 mph above the speed limit on a freeway within the past 30 days, 26.9% admitted to having run a red light at least once within the past 30 days, and 21.8% admitted to driving aggressively by tailgating or changing lanes quickly at least once within the past 30 days. (AAA Foundation for Traffic Safety, December 2024).
- A survey of 2,388 drivers from May through June 2023 asked whether they had committed any acts of aggressive driving or road rage within the past year. The percentages who had engaged in such acts varied with the ages of the drivers. Younger drivers were more likely to have engaged in aggressive driving. See the following table. (The Zebra, April 2024)
|
Age Group of Drivers |
% Self-Reported Aggressive Driving |
|
Generation Z |
73% |
|
Millennials |
61% |
|
Generation X |
54% |
|
Boomers |
44% |
- In a massive survey of 26.4% of America’s school bus drivers from March through May 2024, the bus drivers reported being illegally passed by a total of 66,322 vehicles in a single workday. Extrapolating to 100% of America’s school bus drivers, over 251,000 illegal passings may have taken place on a single workday. (For the purpose of this survey, an “illegal passing” was defined as passing a stopped school bus whose STOP arm had been extended.) (National Association of State Directors of Pupil Transportation Services (NASDPTS), July 2024)
- A study of five busy intersections without red-light cameras found that motorists ran red lights at an average of about once every 20 minutes at each intersection. Another study of 19 intersections without red-light cameras in four states found that drivers were running red lights at an average rate of 3.2 per hour per intersection (i.e., once every 19 minutes at each intersection). (IIHS, June 2024).
- As of May 2024, 19 states and Washington, DC have enacted laws permitting the installation of speed cameras to detect vehicles exceeding the speed limit. Nine states have prohibited the installation of speed cameras. On a related note, 22 states and Washington, DC have enacted laws permitting the installation of red-light cameras to detect vehicles running red lights. Eight states have prohibited the installation of red-light cameras. (Governors Highway Safety Association, May 2024)
- All states have laws against various unsafe driving behaviors, such as running a red light, although the laws vary among states. However, as of March 2024, only 11 states have passed laws specifically defining aggressive driving actions. (Governors Highway Safety Association, March 2024)
Pedestrian Safety Statistics
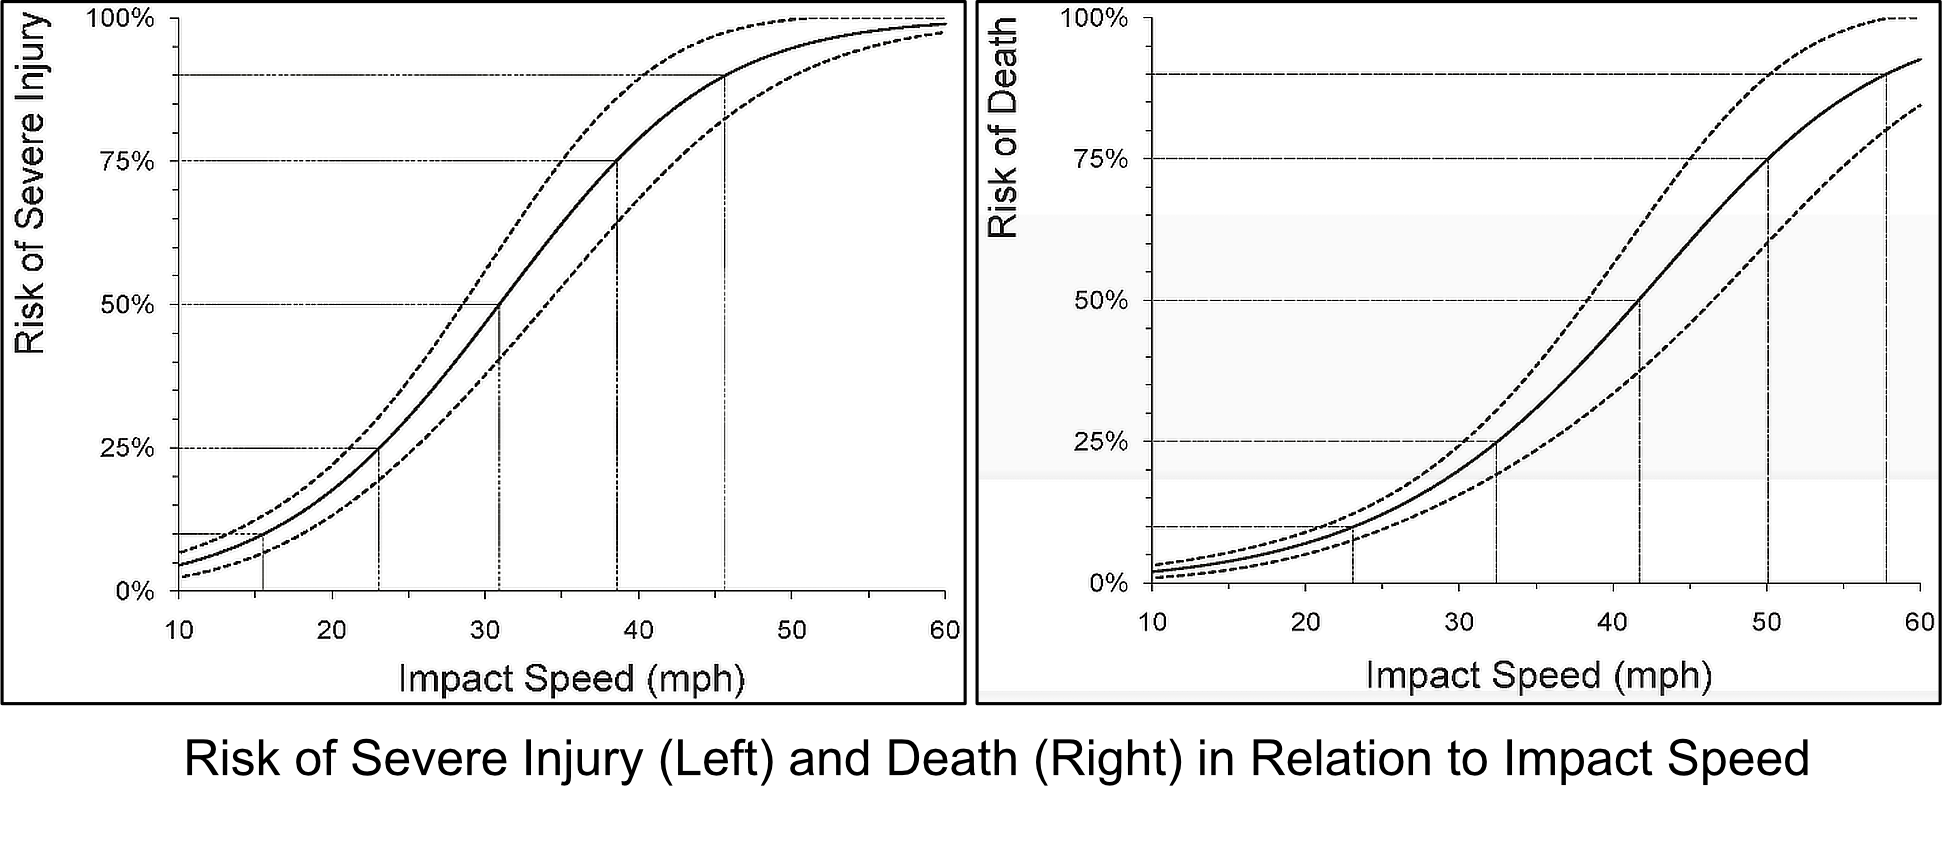
- Pedestrians have a 90% chance of surviving a crash at 30 kph (19 mph) or less but only a 50% chance at higher speeds. (AutoInsurance.org, 2018)
- For a pedestrian, the risk of death or serious injury increases along an S-shaped curve as the vehicle impact speed increases. The following charts from the AAA Foundation for Traffic Safety show the risk of severe injury and the risk of death to a pedestrian as a function of vehicle impact speed. The risk was calculated from a sample of 422 pedestrians who had been struck by a car or light truck during the years 1994 through 1998. (AAA Foundation for Traffic Safety, 2011; NHTSA, 2023)
- In 2022, there were 1,149 fatalities and over 107,000 injuries in collisions that involved vehicles running red lights. Half of those killed were pedestrians, bicyclists, and occupants of other vehicles that were hit. (IIHS, June 2024)
- In 2022, 7,522 pedestrians were killed and over 67,000 were injured in traffic crashes. On the average, a pedestrian was killed every 70 minutes in traffic crashes. That year, 18% of traffic fatalities and 3% of traffic injuries nationwide were pedestrians. (NHTSA, July 2024)
- In 2022, 78% of pedestrian fatalities occurred in the dark, 19% in daylight, 2% at dawn, and 2% at dusk. (NHTSA, July 2024)
- In 2022, 16% of pedestrian fatalities occurred at intersections, 75% of pedestrian fatalities occurred at non-intersection roadway locations, and 9% occurred at other locations, such as sidewalks, parking lanes/zones, and shared use paths. (NHTSA, July 2024)
- In 2022, 24% of pedestrians killed in traffic crashes had been struck by hit-and-run drivers (NHTSA, July 2024).
- A study of 60 “hot spot” locations (where at least six pedestrian fatalities had occurred in the previous eight years) found that these locations were characterized by five or more lanes to cross (70%), speed limits of 30 mph or higher (77%), and traffic volumes exceeding 25,000 vehicles per day (62%). (Schneider et al., January 2021)
- In 2022, an estimated 30% of fatal pedestrian traffic crashes involved a pedestrian fatality whose blood alcohol concentration (BAC) was 0.08% or higher (the legal threshold for intoxication) at the time of the crash. An estimated 18% of fatal pedestrian traffic crashes involved a driver whose BAC was 0.08% or higher. An estimated 6% of fatal pedestrian crashes involved both a driver and a pedestrian fatality who were legally intoxicated at the time. (NHTSA, July 2024)
- Also see the discussion of backover crashes in the section Child Safety Statistics.
Motorcyclist Safety Statistics
- In 2022, there were 9,567,664 registered motorcycles, which traveled a total of 23.765 billion vehicle miles traveled (VMT). (NHTSA, July 2024)
- In 2022, motorcycles made up 3.4% of all registered vehicles but accounted for only 0.7% of all vehicle miles traveled (VMT). (NHTSA, July 2024)
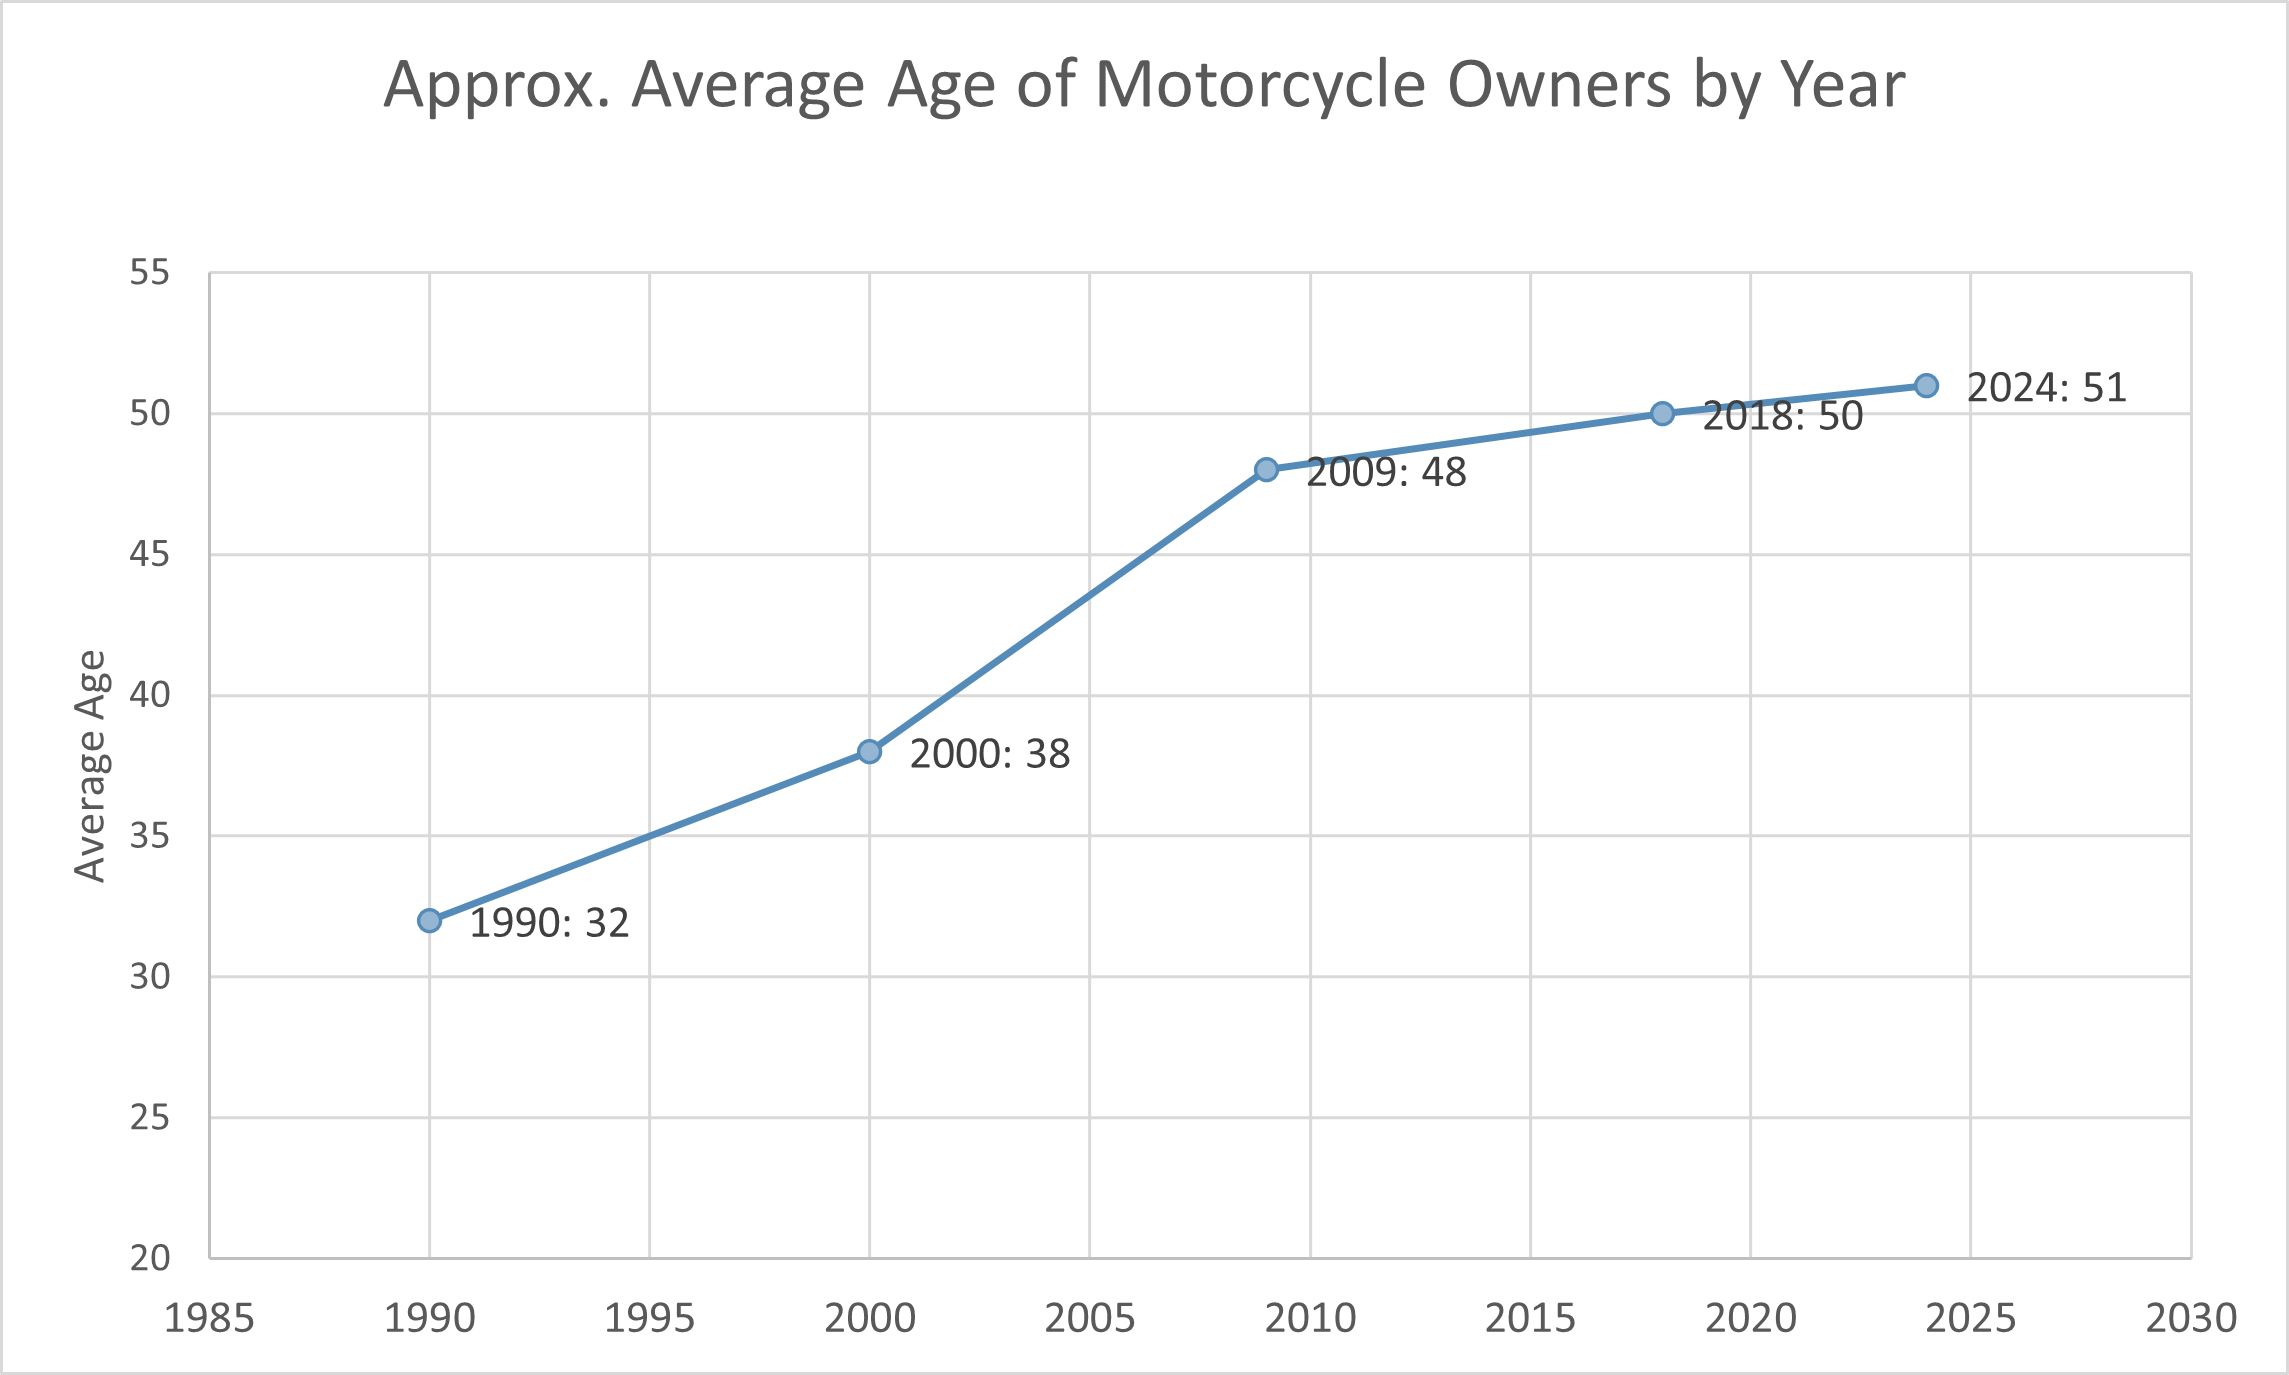
- The approximate average age of motorcycle owners has increased significantly in the last few decades, from 32 in 1990 to 51 in 2024. See the following chart. (Unfortunately, data was available for only five of the years from 1990 to 2024.) (IIHS, December 2024)
- In 2022, the fatality rate per 100,000 registered vehicles was 7.31 for light trucks, 12.13 for passenger cars, and 64.99 for motorcycles (i.e., five times the fatality rate for passenger cars and nine times the rate for light trucks). Likewise, the fatality rate per 100 million VMT was 0.72 for light trucks, 1.20 for passenger cars, and a whopping 26.16 for motorcycles (i.e., 22 times the rate for passenger cars and 36 times the rate for light trucks).
- Since 2016, there has been a general decline in the rate of motorcyclist (both rider and passenger) injuries per 100 million vehicle miles traveled (VMT). This rate declined to 432 in 2021 and then declined sharply to 348 in 2022. However, this sharp decline may have been caused in part by NHTSA’s new rule excluding riders of motorized bicycles from the motorcyclist population from 2022 onward. (NHTSA, July 2024)
- Also see the section on Motorcyclists.
Bicyclist Safety Statistics
- According to the 2024 U.S. Bicycling Participation Study, an estimated 112 million Americans rode a bicycle at least once in 2024. This represents 35% of the U.S. population ages 3 and older. It was the highest participation rate since these studies began in 2014. 56% of Americans between the ages of 3 and 17 rode bikes. This study was based on a survey of 16,000 Americans nationwide. (PeopleForBikes, March 2025)
- Of bicyclists killed in 2022, 15% had been wearing helmets at the time, but 62% had not. The rest were unknown.
Winter Driving Statistics
- 70% of roads in the US are in snowy areas, which receive more than five inches of snow per year. Nearly 70% of the US population lives in those areas. (FHWA, September 2024)
- Freeway speeds are reduced by 3% to 13% in light snow and by 5% to 40% in heavy snow. (FHWA, September 2024)
- An estimated 23% of non-recurrent traffic delays are caused by snow, ice, and fog. (FHWA, September 2024)
- Each year, an average of 21% of all vehicle crashes are classified as weather related; i.e., they occur in adverse weather or on slippery pavement. Most (70%) weather-related crashes happen on wet pavement. The percentages of crashes attributable to various weather-related crashes are listed in the following table. (FHWA, September 2024)
|
Road Weather Conditions |
Percentage of Weather-Related Crashes |
|
Wet pavement |
70% |
|
Rain |
46% |
|
Snow/sleet |
18% |
|
Snowy/slushy pavement |
16% |
|
Icy pavement |
13% |
|
Fog |
3% |
- Each year, over 1,000 people are killed and more than 80,000 people are injured in vehicle crashes on snowy, slushy or icy pavement. Each year, nearly 700 people are killed and over 50,000 people are injured in vehicle crashes during snowfall or sleet. (FHWA, September 2024)
- Each year, over 25,000 traffic crashes occur in fog, resulting in over 400 deaths and nearly 9,000 injuries. (FHWA, September 2024)
- Deicing the roads reduces crashes by about 88% and reduces crash injuries by about 85%. (Safe Winter Roads, accessed April 2025)
- In a 2021 survey of American drivers, 75.8% of respondents had driven on black ice, but 57.9% of respondents had never used snow tires in the winter. 35.1% of respondents named an ice scraper as the most important tool to have in the winter, followed by gloves or mittens (28.0%) and sand or kitty litter (25.4%). (The Zebra, January 2023)
Child Safety Statistics
- From 1998 through April 3, 2025, 1,011 children died of vehicular heatstroke in overheated vehicles – an average of nearly 40 per year. 88% of the victims were age 3 or younger. Heatstroke begins at a body temperature of 104°F and can be lethal at a body temperature of 107°F. (Kids and Car Safety, accessed April 2025; NHTSA, accessed April 2025)
- On a warm day, the temperature inside a car can exceed 150°F. 80% of the total increase in temperature happens in the first 30 minutes. A young child's body can overheat 3 to 5 times faster than an adult's body. Children have died of heatstroke even when the outside temperature was as low as 60 degrees. (Kids and Car Safety, accessed April 2025)
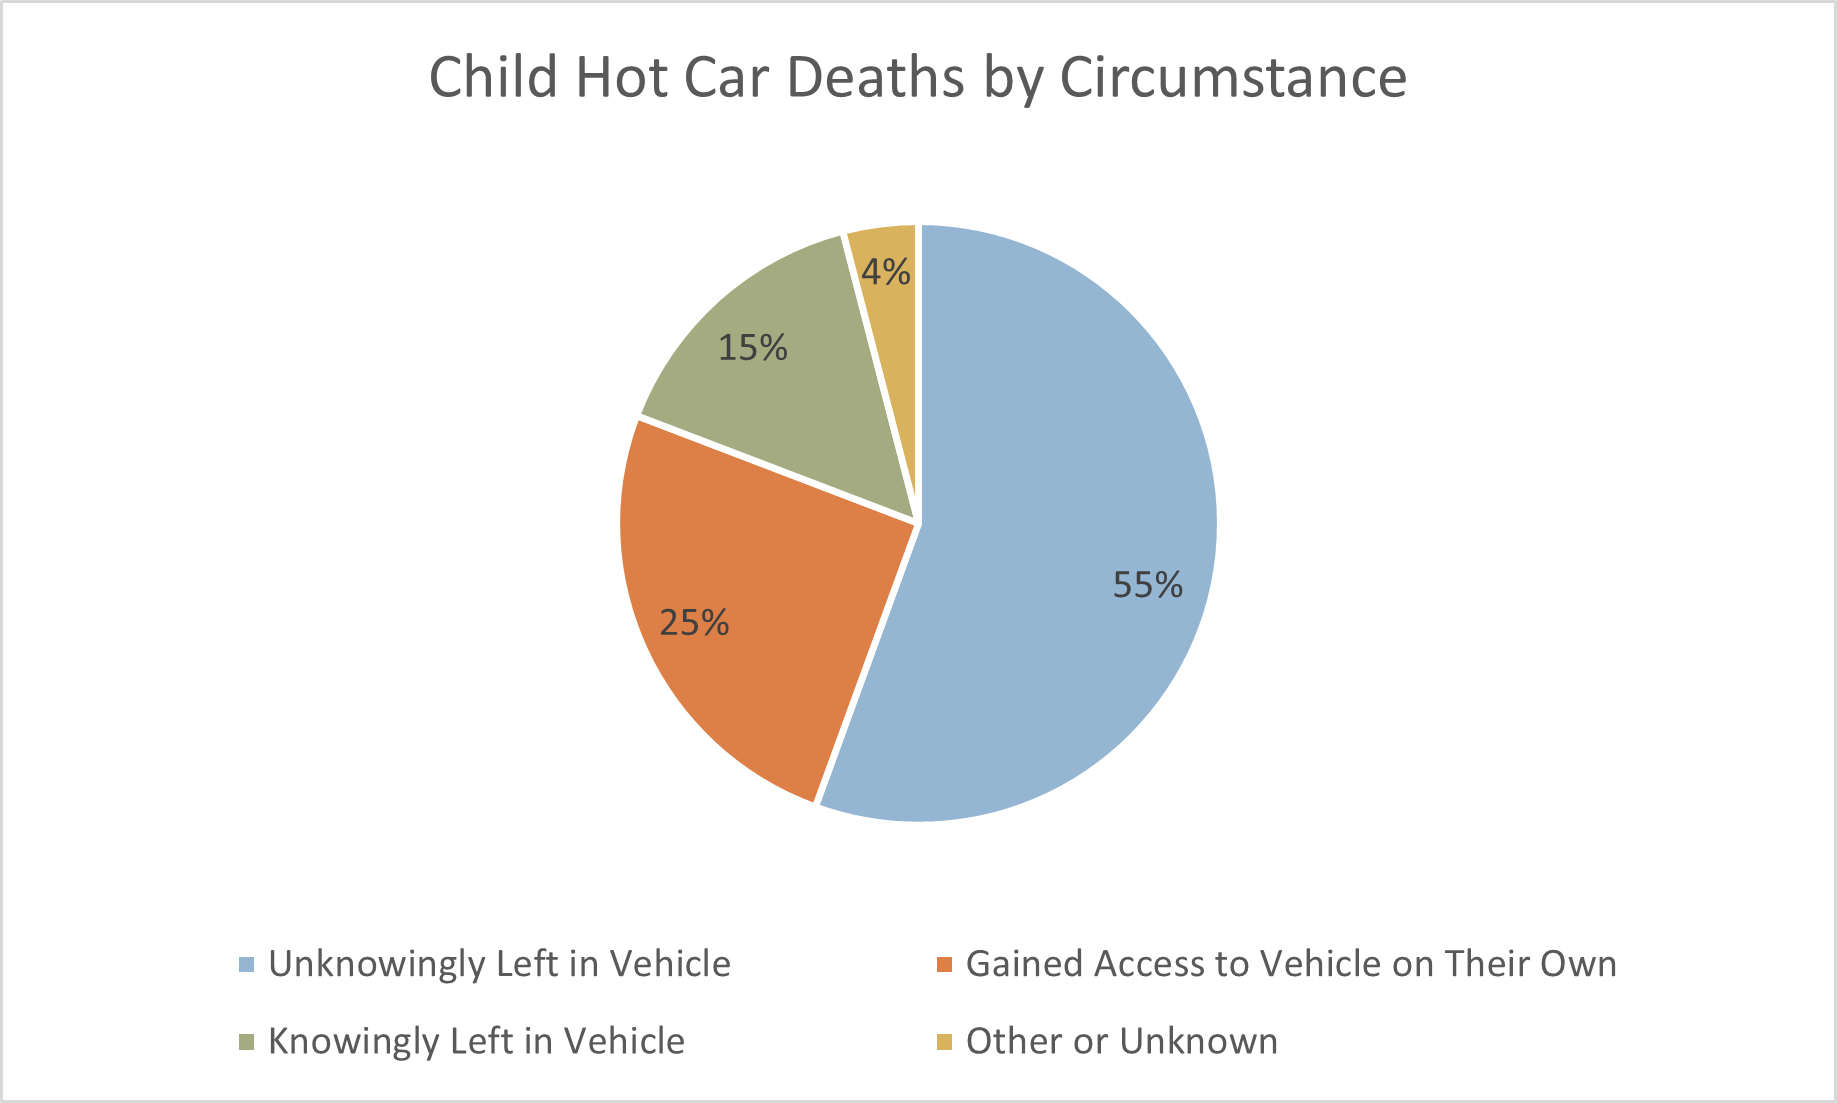
- Of the children who died in overheated vehicles in 1990–2024, 55% were unknowingly left in the vehicle, but 25% gained access to the vehicle on their own. See the following chart. (Kids and Car Safety, accessed April 2025)
- At least 50 children per week are backed over by vehicles, of whom an average of two die. The predominant age of young backover victims is 12–23 months of age. Over 60% of these backovers involve a larger vehicle (truck, van, or SUV). In over 70% of these backovers, a parent or close relative was behind the wheel. (Kids and Car Safety, accessed April 2025)
- Also see the section Seat Belt and Child Restraint Statistics.
General Statistics on Driving-Related Fatalities
- The World Health Organization (WHO) estimates that each year, road traffic crashes worldwide kill about 1.19 million people and injure 20–50 million more, many of whom are left with a disability. (World Health Organization, 2025)
- In the United States in 2022, there were 5,930,496 police-reported motor vehicle crashes, including 39,221 fatal crashes and 1,664,598 injury crashes. (NHTSA, December 2024)
- In the United States in 2022, there were 42,514 traffic crash deaths. The rate of crash deaths per 100,000 people was 12.76, representing a 38.1% decline from the rate in 1975 (20.62). However, there was an uptick in 2020–2021. There were 11.07 deaths per 100,000 people in 2019, 11.77 deaths per 100,000 people in 2020, and 13.02 deaths per 100,000 people in 2021, representing a 17.6% increase over 2019. (IIHS, June 2024)
- In 2022, there were 23 driver deaths in single-vehicle crashes per million registered cars and 42 driver deaths in multiple-vehicle crashes per million registered cars. This compares with 11 single-vehicle crash deaths per million registered SUVs and 20 multiple-vehicle crash deaths per million SUVs, about half the rates of cars. For pickup trucks, there were 20 single-vehicle crash deaths per million registered pickups and 19 multiple-vehicle crash deaths per million pickups. (IIHS, June 2024)
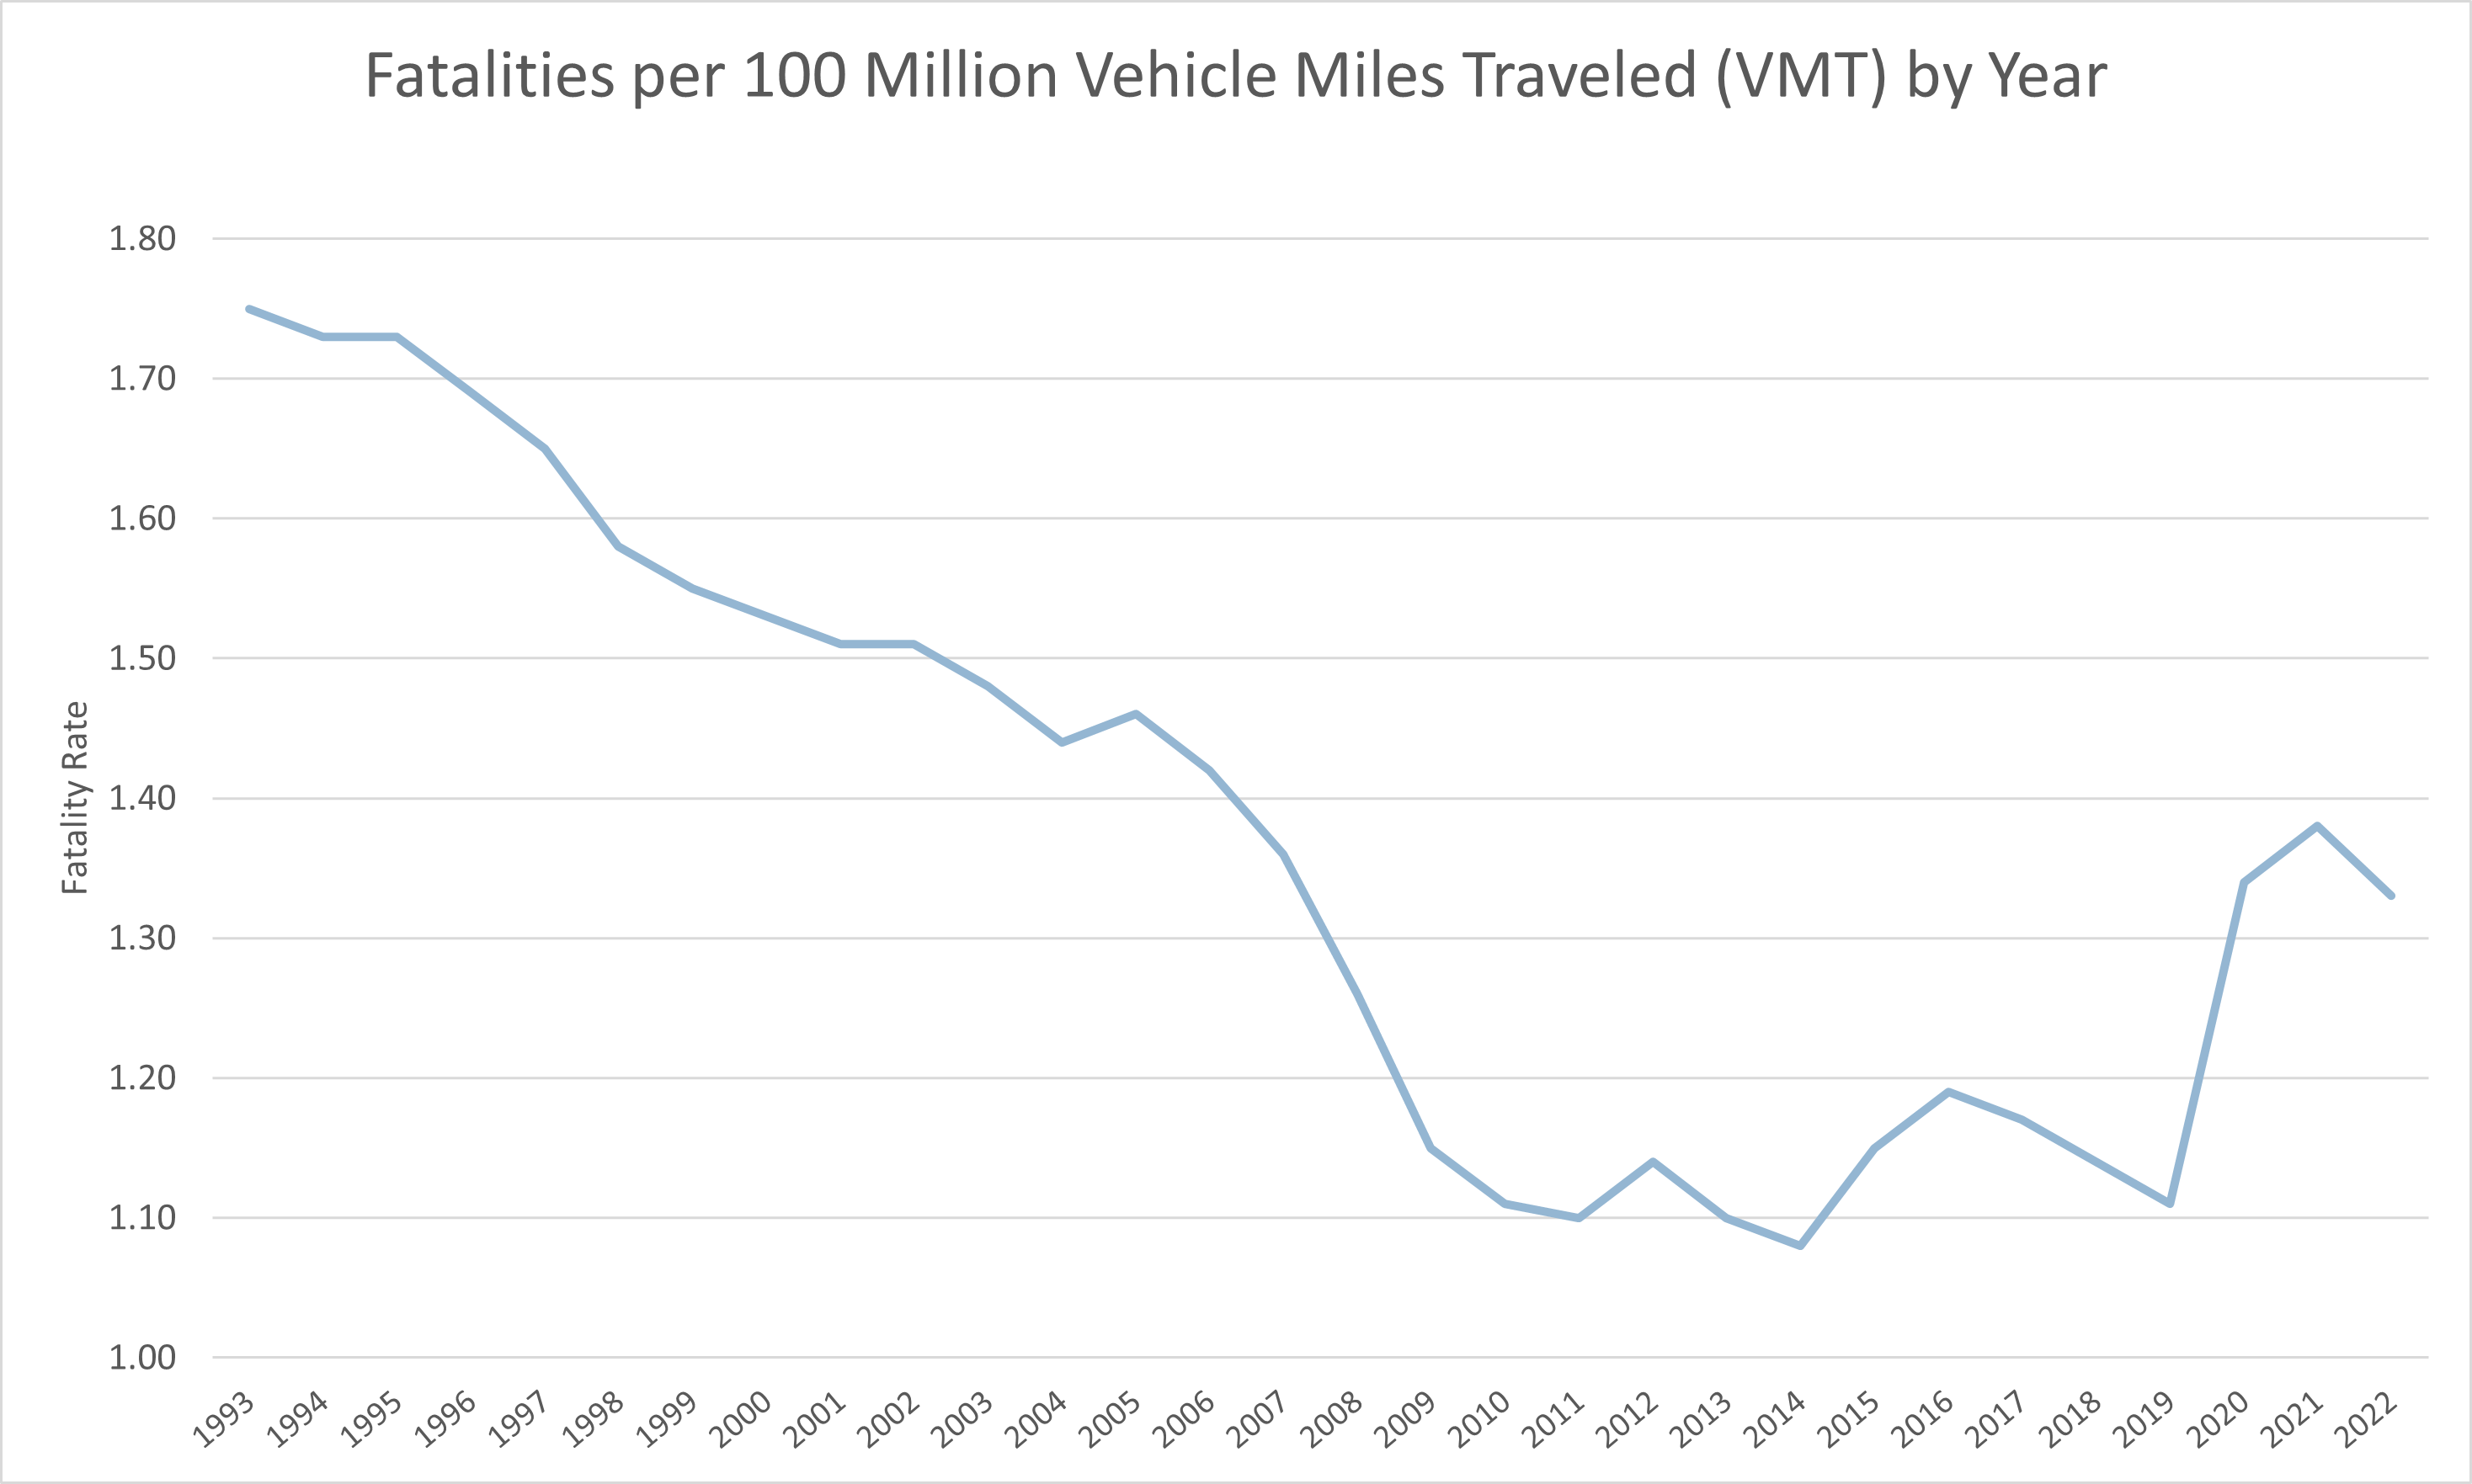
- From 1993 to 2014, the fatality rate per 100 million vehicle miles traveled (VMT) had declined from 1.75 to 1.08, a drop of 38.3%. However, there was a noticeable uptick in the fatality rate during the COVID pandemic years. See the following chart. (NHTSA, December 2024)
- The vehicle occupant fatality rate (including motorcycle operators and passengers) per 100,000 population declined by 39% between 1975 and 2022. (NHTSA, December 2024)
- The nonoccupant fatality rate per 100,000 population declined by 32% from 1975 to 2022. (Nonoccupants include pedestrians, bicyclists, and persons inside parked vehicles.) (NHTSA, December 2024)
- In 2022, 31% of all traffic crashes involved alcohol-impaired (blood alcohol content 0.08% or higher) driving. 55% of traffic crashes between midnight and 2:59 a.m. involved alcohol-impaired driving. (NHTSA, December 2024)
- In 2022, the three-hour period of the week with the most fatal crashes was 9:00 p.m. to 11:59 p.m. on Saturdays, with 1,263 fatal crashes. The second-deadliest period was midnight to 2:59 a.m. on Sundays, with 1,239 fatal crashes. (NHTSA, December 2024)
- In 2022, 57% of fatal traffic crashes were single-vehicle crashes, compared with 30% of injury crashes and 30% of property-damage-only crashes. (NHTSA, December 2024)
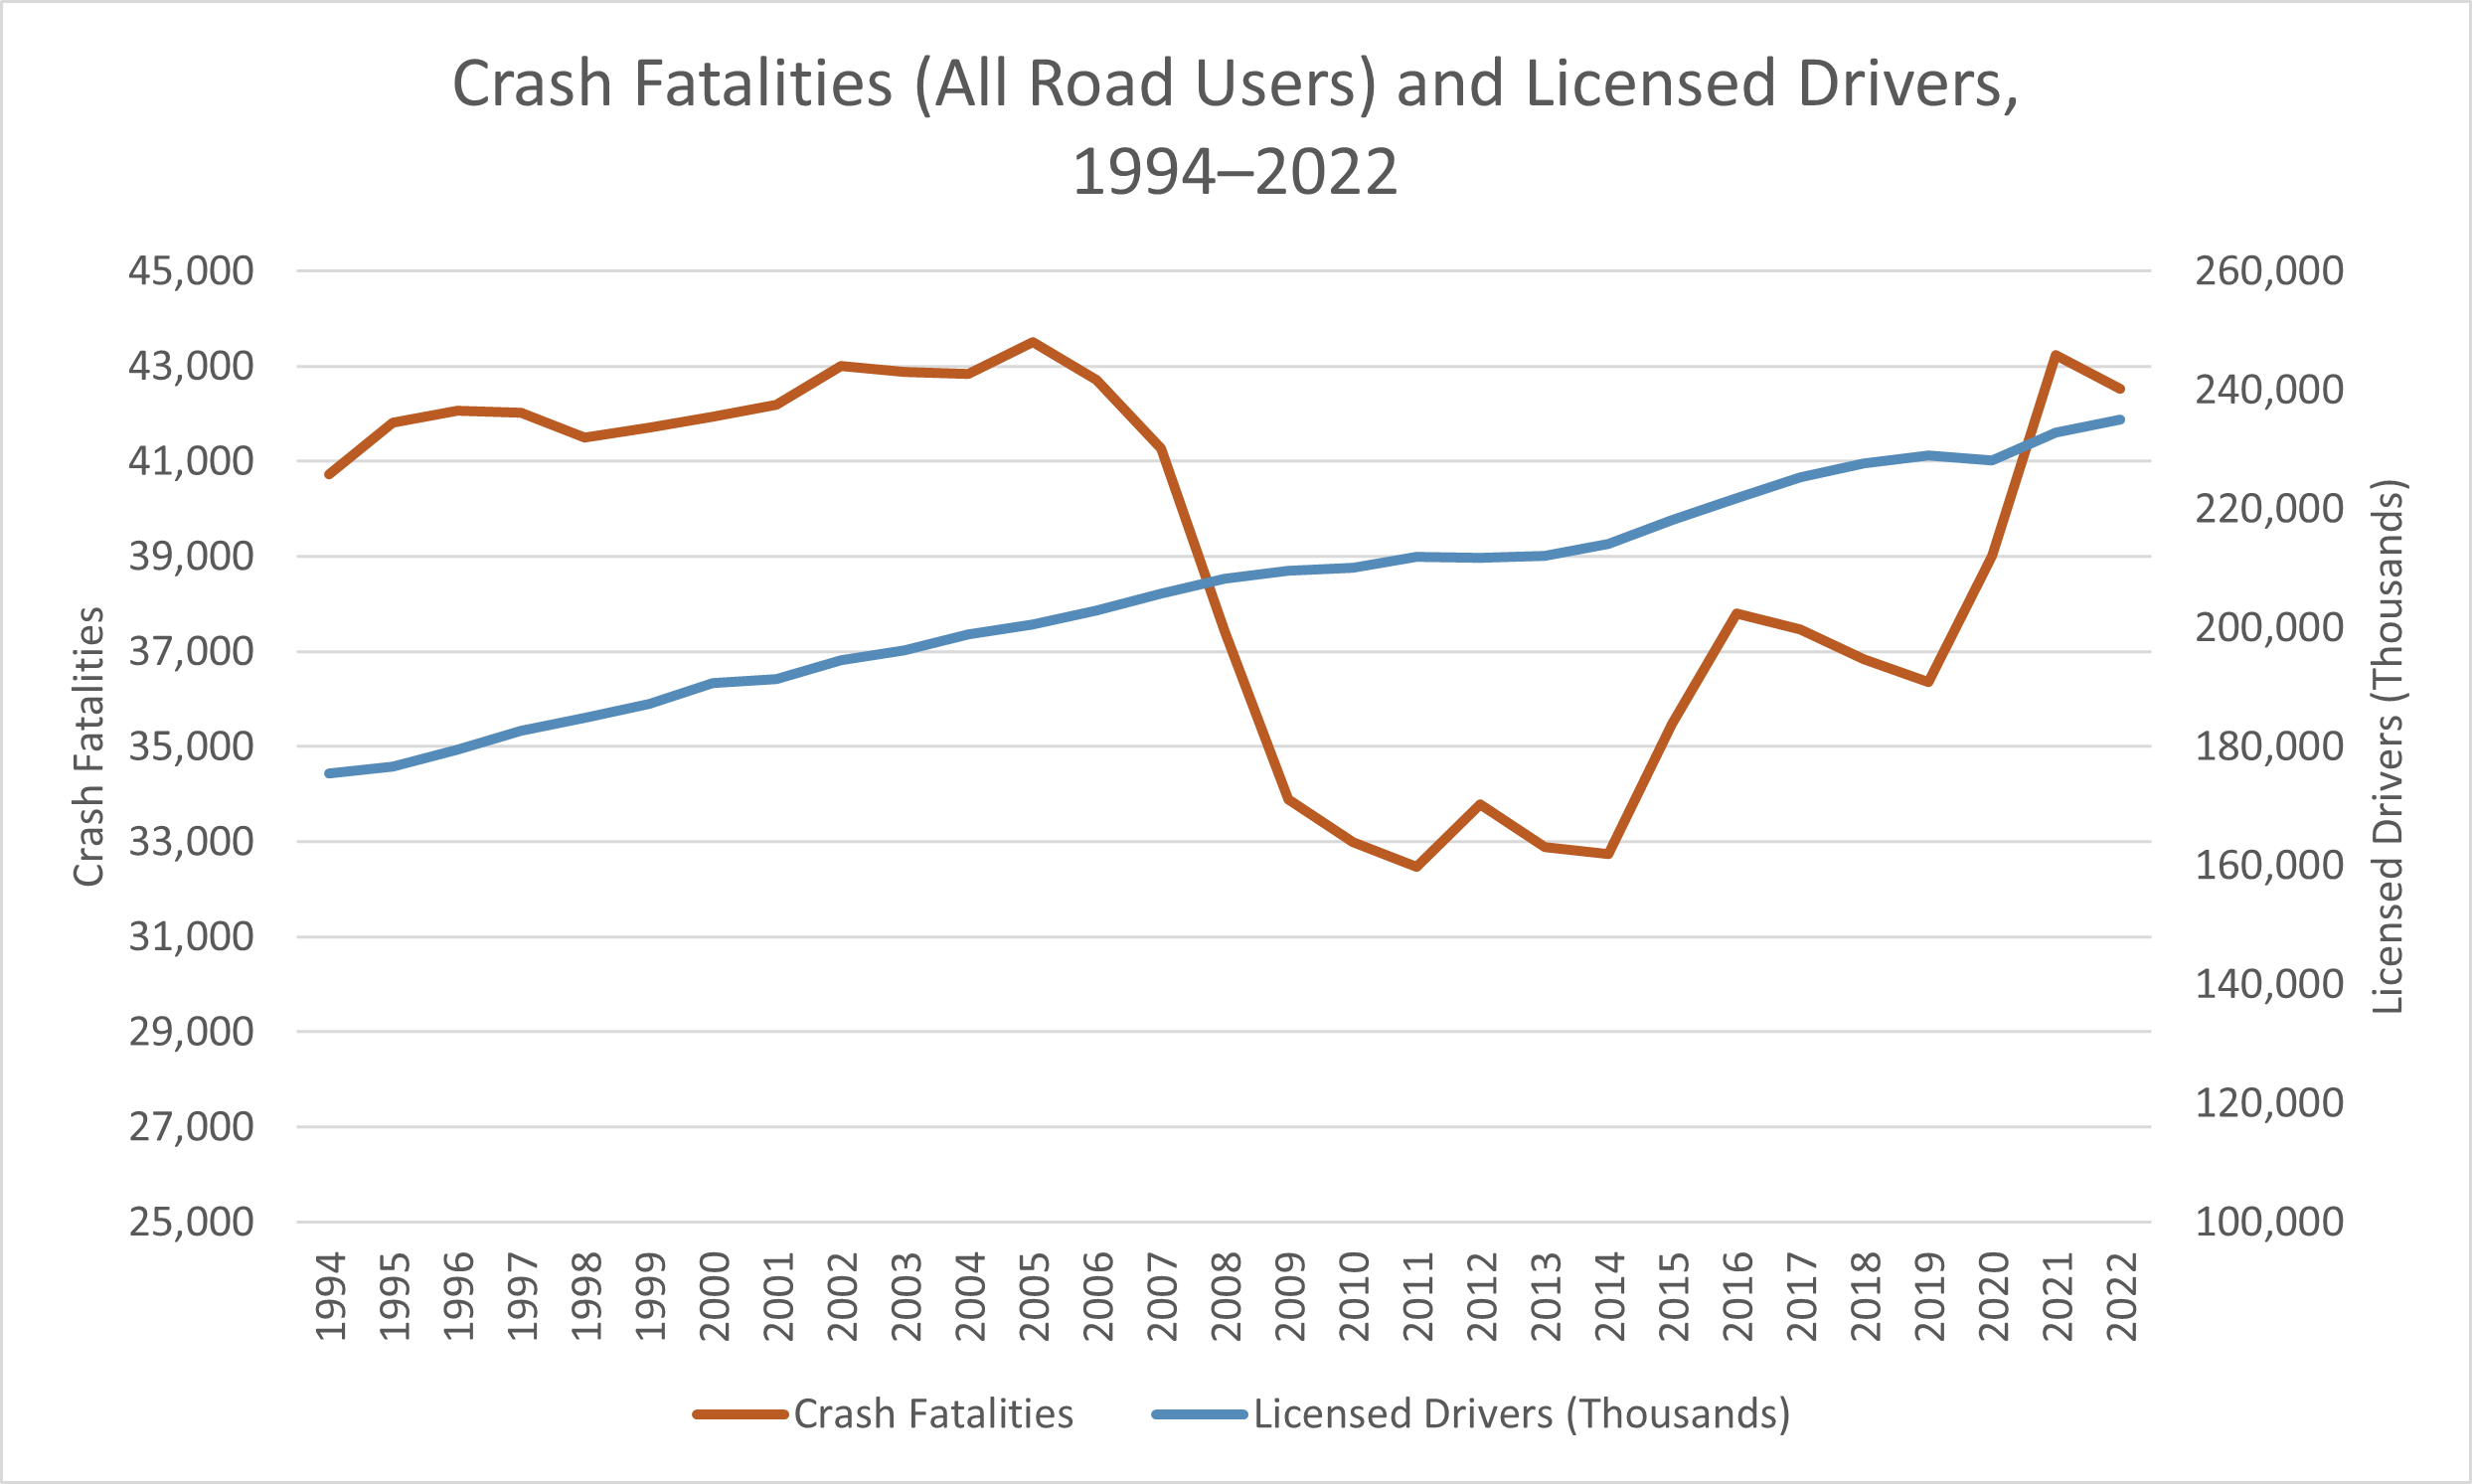
- From 1994 to 2019, crash fatalities declined by 10.7% even though the number of licensed drivers increased by 30.5%. In 2020–2021, there was a sharp 18.9% uptick in crash fatalities. Still, even though crash fatalities increased by 5.5% from 1994 to 2021, the number of licensed drivers increased by 32.7% during that same period. See the following chart. (Fatality Analysis Reporting System, NHTSA, accessed May 2025)
- In 2022, there were 12.76 motor vehicle deaths per 100,000 population, down 14.2% from 14.87 per 100,000 population in 2000. By 2019, this rate had already declined by 25.6% to 11.07 per 100,000 population. However, there followed a significant uptick in the rate in 2020 and 2021.)
- From 1975 to 2022, car occupant deaths declined by 51.1%, In comparison, light truck (mostly SUV and pickup truck) occupant deaths rose by 162.1% (i.e., more than doubled). (NHTSA classifies SUVs as light trucks, not as cars.) (NHTSA, December 2024)
- In 2022, 29% of all passenger-vehicle occupant deaths occurred in rollovers. These deaths included 13% of the deaths in multi-vehicle crashes and 49% of single-vehicle crash deaths. That same year, 21% of occupant fatalities in cars, 37% of occupant fatalities in SUVs, and 39% of occupant fatalities in pickup trucks involved a rollover. (IIHS, June 2024)
- In 2022, 7,418 passenger vehicle occupants died in rollover crashes. 77% of these deaths followed a pre-rollover impact; the other 23% occurred without a pre-rollover collision. Crashes involving a rollover caused 29% of all passenger vehicle occupant deaths. (IIHS, June 2024)
- In 2022, single-vehicle rollover crashes accounted for 17% of occupant deaths in cars, 26% of occupant deaths in SUVs, and 30% of occupant deaths in pickup trucks. (IIHS, June 2024).
- Rollovers have been disproportionately represented in injury crashes and especially in fatal crashes. For example, for pickup trucks in 2022, 3.1% of all crashes and just 1.7% of property-damage-only crashes involved rollovers, but 6.2% of injury crashes and 20.8% of fatal crashes involved rollovers. This rate exceeded the rollover rates in fatal crashes of all other common types of motor vehicles. See the following table for other types of vehicles except motorcycles. (NHTSA classifies SUVs and vans as light trucks.) (NHTSA, December 2024)
- In fatal large truck crashes in 2019, 15.3% of the fatalities were the truck drivers themselves. The drivers of other vehicles made up 55.3% of the fatalities, the passengers in the other vehicles made up 15.5%, and the passengers in the large trucks made up 2.4% of the fatalities.. 9.0% of the fatalities were pedestrians, and 1.8% were cyclists. (FMCSA, November 2023)
- Note: In 2020 and 2021, these proportions changed radically as fewer passenger cars and light trucks were on the road, no doubt because of the COVID pandemic and its associated temporary travel restrictions. In fatal large truck crashes in 2021, 70.7% of the fatalities were the truck drivers themselves, and virtually zero fatalities were the drivers or passengers of passenger cars or light trucks. (FMCSA, November 2023)
Fatalities by Location
- In Canada in 2021, there were 4.7 traffic fatalities per 100,000 population, up from 4.6 in 2021. These were the lowest rates per 100,000 population on record. (Transport Canada, April 2023)
- In Canada in 2021, there were 4.8 fatalities per billion vehicle kilometers traveled, up from 4.7 in 2020. (Transport Canada, April 2023)
- In Canada in 2020, the estimated social costs of traffic collisions, including injuries and fatalities, totaled about $36 billion. This represented about 1.9% of Canada's annual Gross Domestic Product (GDP). (Transport Canada, January 2023)
- In Canada in 2021, there were 1,768 motor vehicle fatalities, up 1.3% from 2020. There were 8,185 serious injuries resulting from traffic crashes, up 4.0% from 2020. (Transport Canada, April 2023)
- In the European Union, there were about 20,384 road fatalities in 2023, down about 1% from 2022. 44% of these fatalities were car occupants, and 20% were occupants of two-wheeled motor vehicles (motorcycles and mopeds). Pedestrians accounted for 18% of fatalities, and cyclists for 10%. (European Commission, March 2025)
- In the European Union in 2023, Sweden had the lowest road fatality rate (22 road deaths per million inhabitants), and Bulgaria had the highest rate (82 road deaths per million inhabitants). Romania was a close second, with 81 road deaths per million inhabitants. The EU average was 46 road deaths per million inhabitants. (European Commission, March 2024)
- Road traffic deaths worldwide average about 1.19 million per year. (WHO, December 2023)
- In 2023, low- and middle-income countries accounted for about 60% of the world’s vehicles but 92% of the world’s road traffic fatalities. (WHO, December 2023)
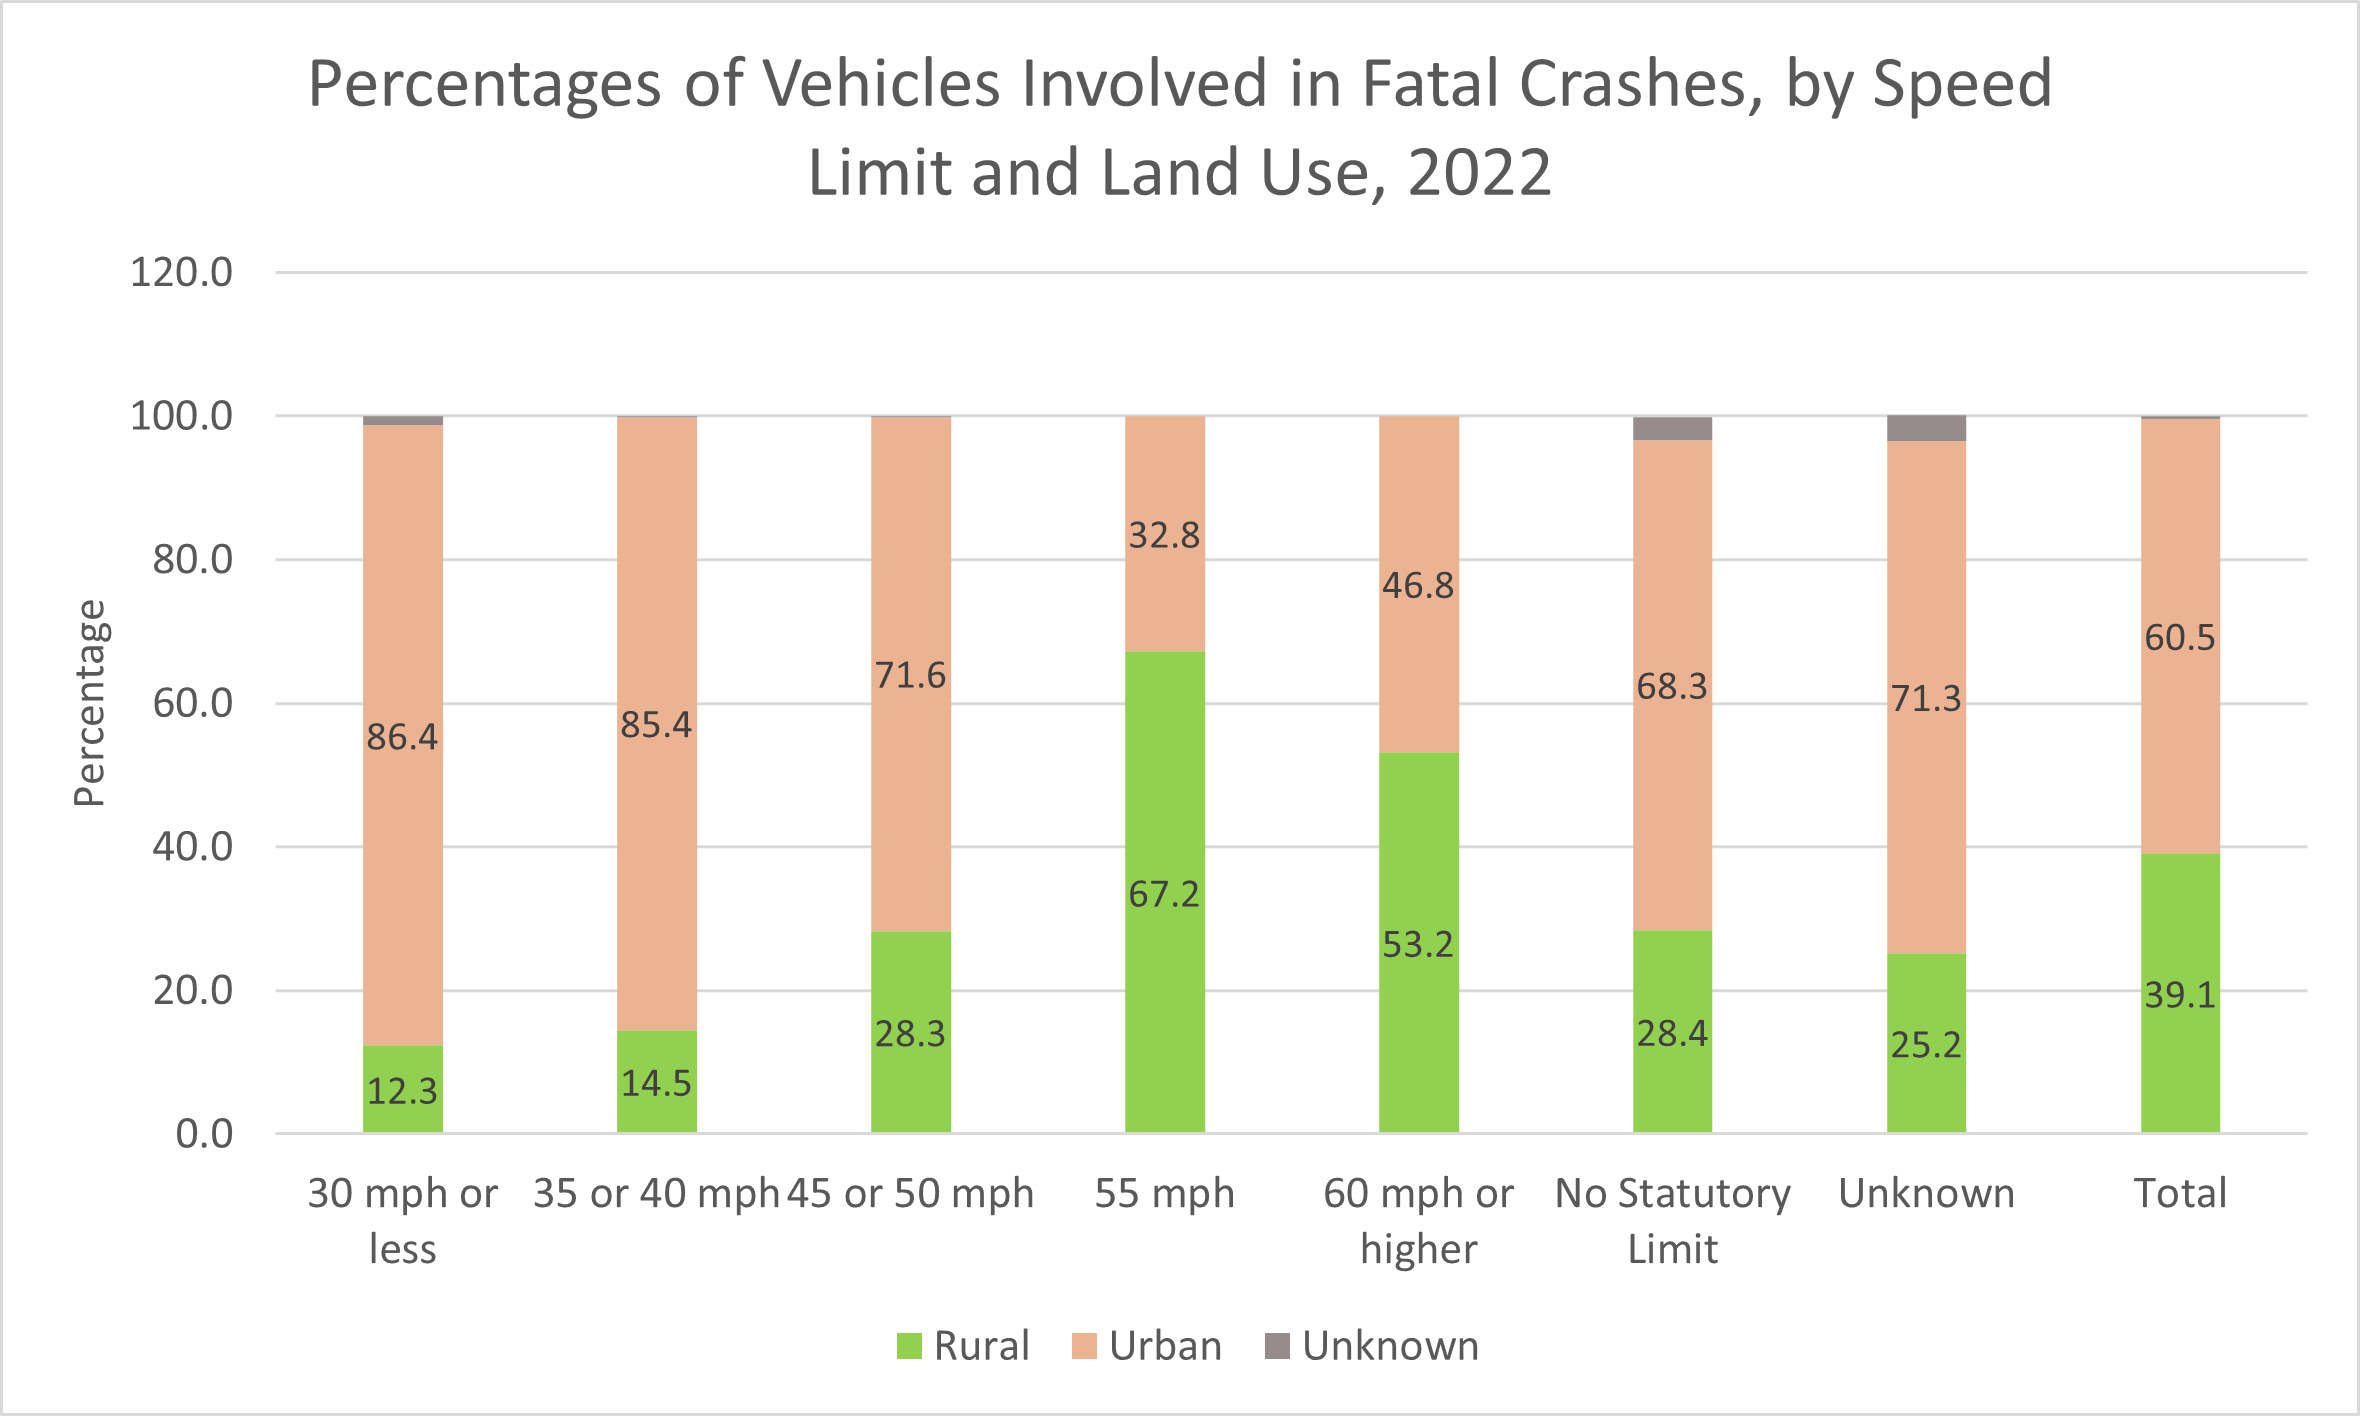
- In 2022, 60.5% of the vehicles involved in fatal crashes in the United States were in urban areas at the time, and 39.1% were in rural areas. The areas of the rest were unknown. Most of the vehicles in low-speed fatal crashes were in urban areas at the time, but most of those in high-speed fatal crashes were in rural areas. See the following chart. (NHTSA, December 2024)
- In 2022, 21.6% of the 60,501 fatal traffic crashes took place at intersections. Another 7.8% were intersection related. (A crash is considered “intersection related” if it occurs next to an intersection and is caused by the movement or actions of traffic within the intersection.) 60.9% of fatal crashes did not occur at road junctions (intersections and interchanges). The remainder were unknown. (NHTSA, December 2024)
- For the intersection- and intersection-related fatal traffic crashes that occurred in 2022, 40.9% of the intersections were controlled by traffic signals, 17.1% were controlled by stop signs, 32.9% were uncontrolled, and the remainder were either controlled differently or by unknown means (if any). (NHTSA, December 2024)
- In 2022, there were about 96,000 traffic crashes in work zones, representing a drop of about 23% from 2018 levels. (National Work Zone Safety Information Clearinghouse, 2025)
- In 2022, there were 821 work zone fatal crashes with 891 work zone crash fatalities, up 22.0% and 17.7% respectively from 2018 levels. These 891 work zone fatalities included 742 drivers and passengers, 136 pedestrians, and 9 bicyclists. Surprisingly, 105 (77%) of these 136 pedestrian fatalities were not considered workers in the work zones. However, these numbers may partly depend on the criteria for classifying pedestrians as roadside workers. Some other estimates place the percentage of roadside worker fatalities at up to 38% of all work zone pedestrian fatalities. (FHWA, April 2024; National Work Zone Safety Information Clearinghouse, 2025)
- Of the 821 work zone fatal crashes in 2022, 281 (34%) involved speeding, 246 (30%) involved a commercial motor vehicle (CMV), and 174 (21%) involved a rear-end collision. (FHWA, April 2024)
- One work zone fatality occurs for every 4 billion vehicle miles traveled (VMT) and for every $112 million worth of roadway construction expenditures. (FHWA, 2019)
- In 2021, there were 5,149 fatal crashes involving large trucks. 288 of these crashes (5.6%) occurred in work zones. (FMCSA, December 2023)
- There are approximately 212,000 railroad grade crossings (where a roadway crosses a railroad track at grade) in the United States. These consist of about 129,500 public crossings and about 82,500 private crossings. (Federal Railroad Administration, March 2025)
- Railroad grade crossing collisions and pedestrian trespass on tracks combined account for over 95% of all railroad fatalities. (Operation Lifesaver, 2025)
- From 1972 to 2024, the number of train/motor vehicle collisions in the United States declined from about 12,000 collisions in 1972 to about 2,250 collisions in 2024, a drop of about 81%. (Operation Lifesaver, 2025)
- In 2024, there were 2,252 vehicle crashes at railroad crossings, including 268 fatalities and 749 injuries. (Operation Lifesaver, May 2025)
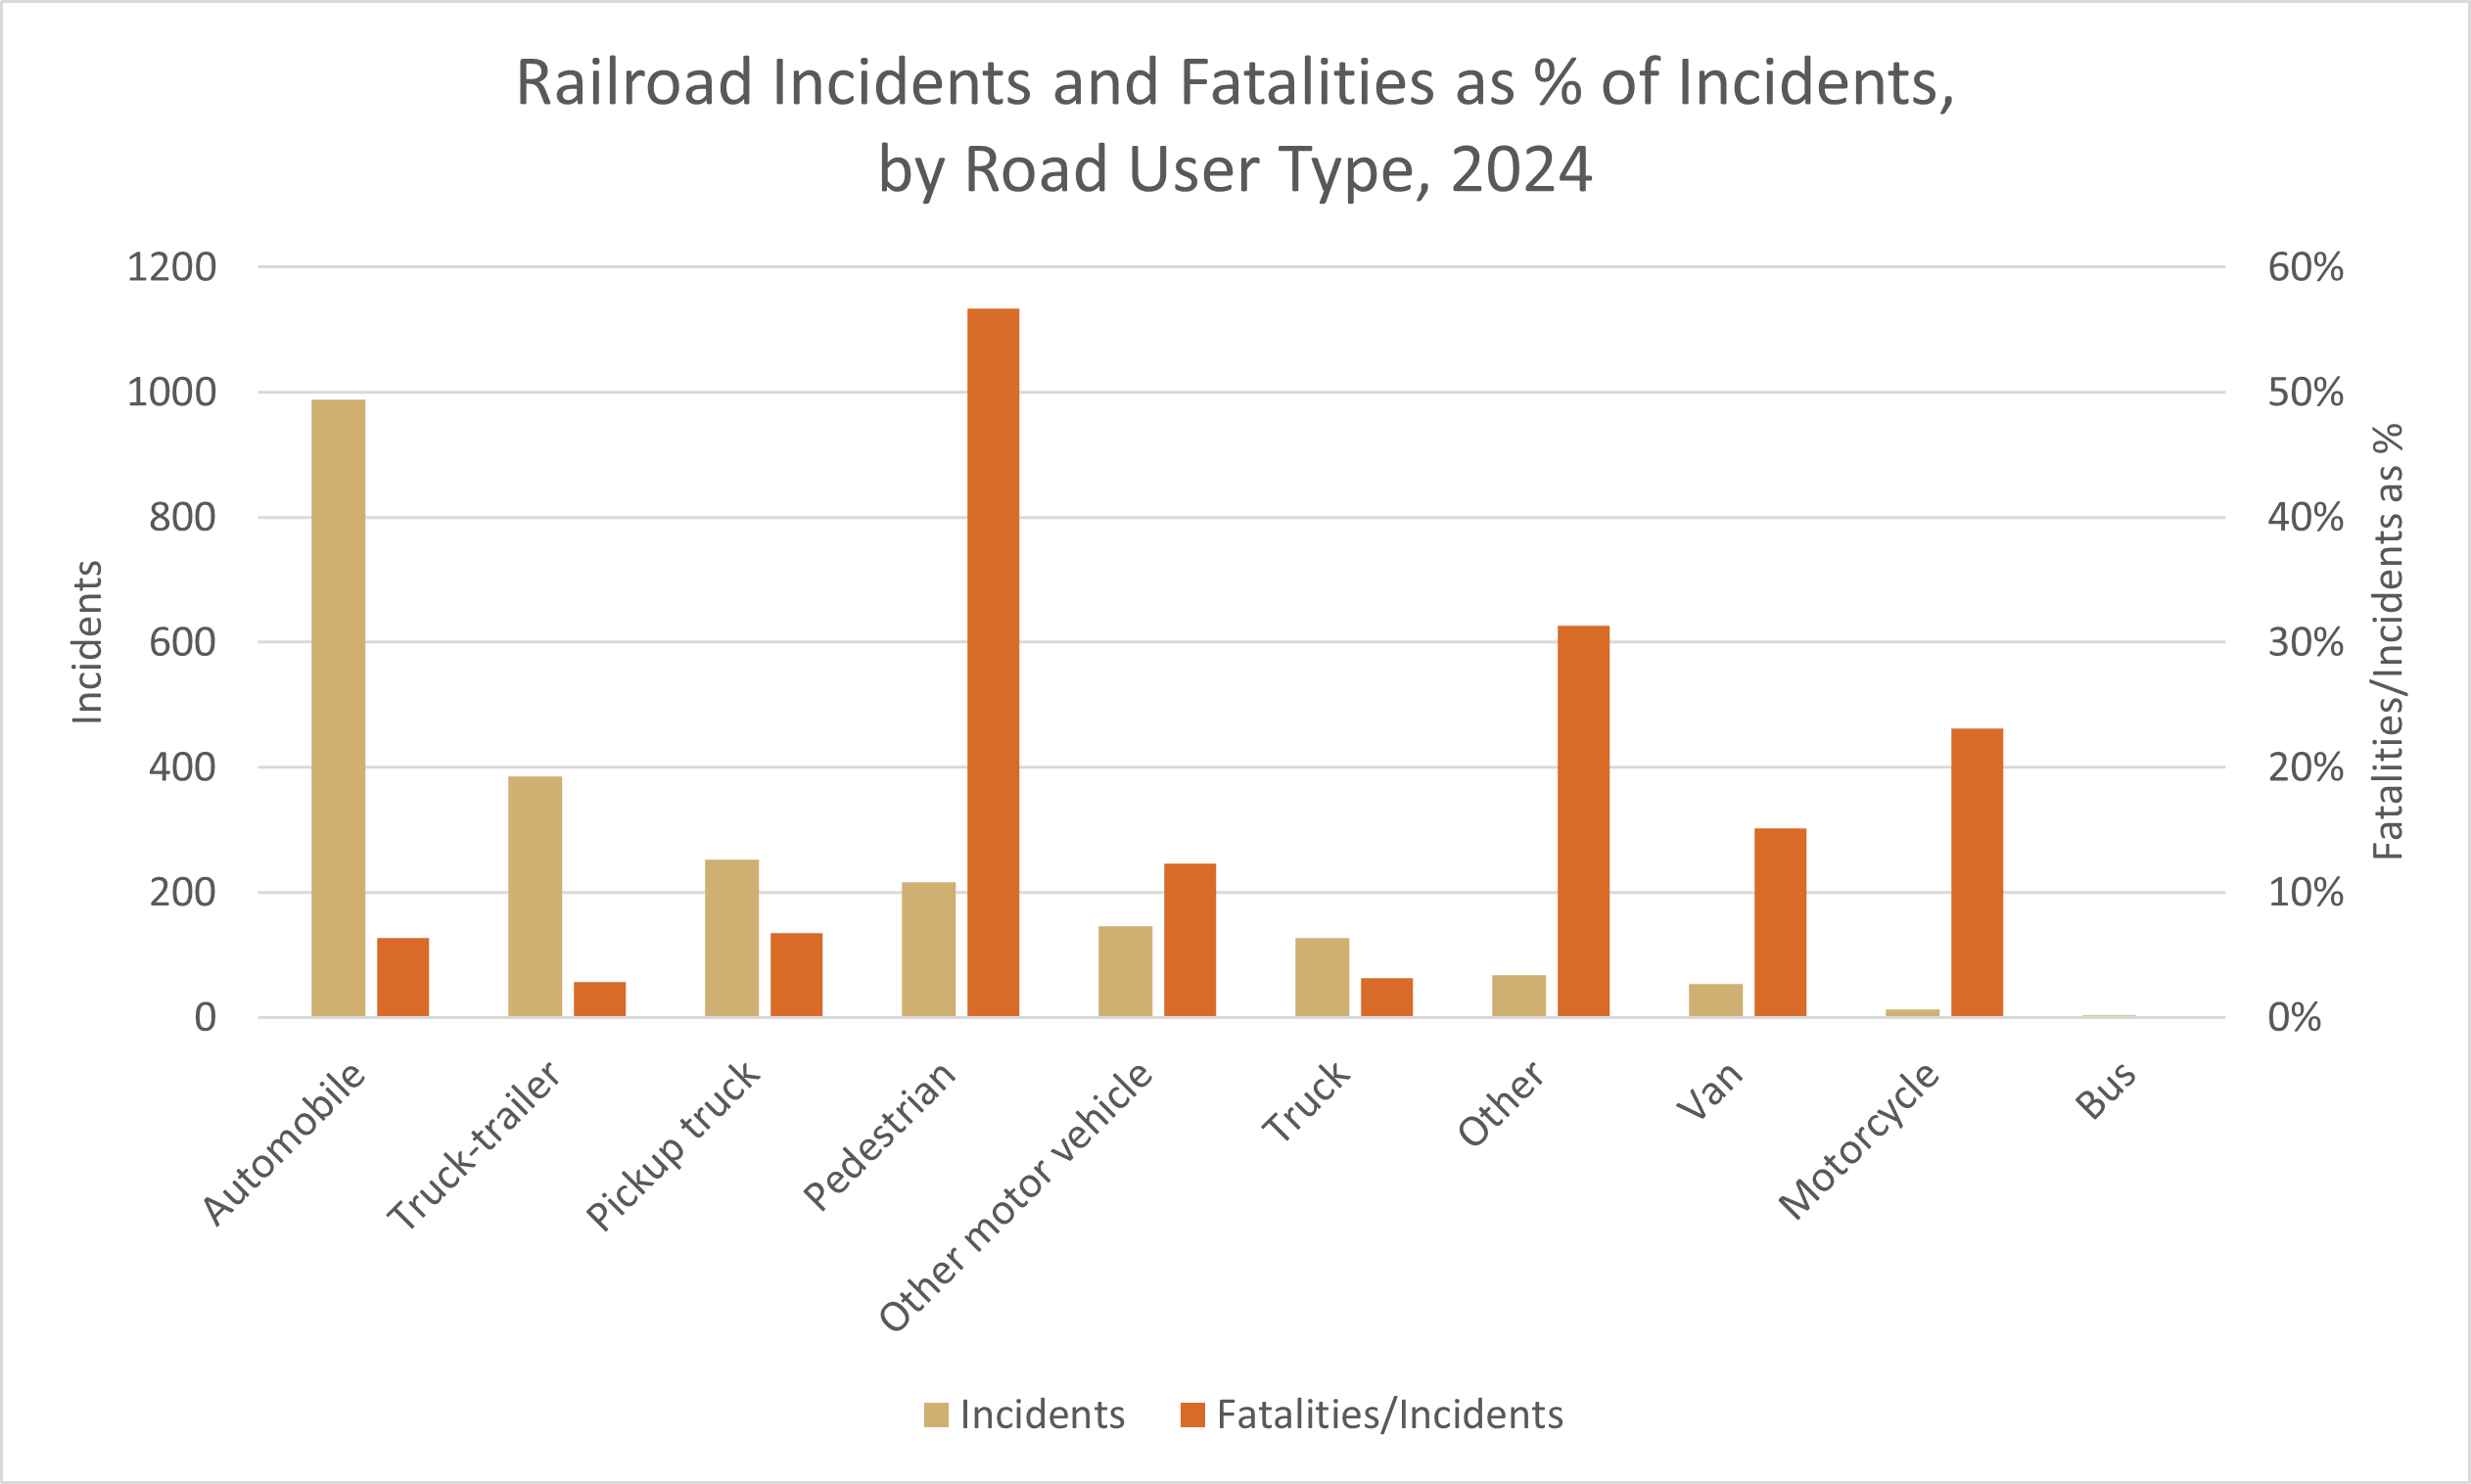
- In 2024, there were 989 railroad crossing collisions involving automobiles, more than for any other type of road user. The number of fatalities as a percentage of the incidents was highest for pedestrians, who are considered vulnerable road users. In contrast, the ratio of fatalities to incidents was lowest for buses and large trucks, perhaps because of the protection afforded by the vehicle’s size and the extra training of the driver. See the following chart. (US Department of Transportation, May 2025)
- In 63.1% of vehicle crashes and 74.6% of fatalities at railroad crossings in 2024, the railroad crossings were equipped with active warning devices (such as signal lights, bells, or automatic gates). (US Department of Transportation, May 2025)
- In 2022, 56% of motorcyclist traffic deaths occurred on major roads other than interstates and freeways. 32% occurred on minor roads, and 12% occurred on interstates and freeways. (IIHS, December 2024)
- In 2022, 66% of motorcyclist traffic deaths occurred in urban areas, and 34% occurred in rural areas. (IIHS, December 2024)
- In 2022, 1,084 bicyclists were killed and 46,195 were injured in motor vehicle crashes, representing about 2% of all traffic crash fatalities that year. Bicyclist fatalities have increased by about 75% since 2010. (IIHS, August 2024)
- In 2022, 83% of bicyclists were killed in urban areas, and 17% in rural areas. The percentage of bicyclist deaths in urban areas has been trending upward since 1975, when 50% of the fatalities occurred in urban areas and 50% in rural areas. (IIHS, August 2024)
- In 2022, 34% of bicyclist deaths occurred at intersections, and 66% occurred elsewhere. (IIHS, August 2024)
- In 2022, there were 7,522 pedestrians killed in traffic collisions, roughly the same as in 1975 but up 83% from the low point in 2009. (IIHS, June 2024)
- In 2022, 85% of pedestrian deaths occurred in urban areas and 15% in rural areas. The percentage of pedestrian fatalities in urban areas has been trending upward since 1975, when 59% of pedestrian fatalities occurred in urban areas. (IIHS, June 2024)
- In 2022, 33% of fatalities among pedestrians aged 70 and older occurred at intersections. In contrast, only 21% of fatalities among pedestrians ages 20–69 occurred at intersections. (IIHS, June 2024)
- In 2022, 60% of pedestrian fatalities occurred on major roads other than interstates and freeways. 21% of pedestrian fatalities occurred on minor roads, and 18% occurred on interstates and freeways. (IIHS, June 2024)
- In 2022, about 27.5% of fatal large truck crashes occurred at intersections. 72.4% took place elsewhere, and the rest were unknown. (Fatality Analysis Reporting System, NHTSA, accessed May 2025)
- In 2022, about 21.0% of motor vehicle crashes occurred in adverse weather or under other adverse atmospheric conditions, such as smoke. (Fatality Analysis Reporting System, NHTSA, accessed May 2025)
- Typically, 70% of weather-related crashes happen on wet pavement, 46% during rainfall, 18% during snow or sleet, 16% on snowy or slushy pavement, 13% on icy pavement, and 3% in fog. (FHWA, 2019)
- In 2022, there were 5,311 fatal crashes involving large trucks. 73.2% of these fatal crashes occurred in good weather (clear or cloudy). 6.5% of the fatal crashes occurred in rain or freezing rain. Only 1.9% occurred in snow or blowing snow, and another 1.7% occurred under such limited-visibility conditions as fog, smog, smoke, or blowing dirt or sand. (Fatality Analysis Reporting System, NHTSA, accessed May 2025)
Fatalities by type of road user
- In 2022, 68% of people killed and injured in traffic crashes were drivers, 23% were passengers, 4% were motorcyclists, 3% were pedestrians, and 2% were pedalcyclists. (NHTSA, December 2024)
Car drivers and light truck drivers
- Note: For such purposes as specifying fuel economy standards, NHTSA considers the category “light trucks” as including vans, minivans, light pickup trucks, sport-utility vehicles (SUVs), and other motor vehicles with a gross vehicle weight rating (GVWR) less than 8,500 pounds and a payload capacity not exceeding 4,000 pounds. These SUVs are not considered passenger cars. (Car and Driver, 2023)
- In 2022, there were 20,049 passenger cars involved in fatal crashes, representing 33.1% of all motor vehicles involved in fatal crashes. 79.2% of these passenger cars were sedans, 8.7% were hatchbacks, and 8.6% of these passenger cars were coupes. (NHTSA, December 2024)
- Of the 20,049 passenger cars involved in fatal crashes in 2022, 12,604 (62.9%) of the cars were in multiple-vehicle crashes, and 7,568 (37.7%) were in single-vehicle crashes. (Fatality Analysis Reporting System, NHTSA, accessed May 2025)
- Of the 20,049 passenger cars involved in fatal crashes in 2022, 12,902 (64.0%) of the cars had sustained a front-impact crash with another moving motor vehicle. 2,278 (11.3%) of the cars had sustained a left-side impact, 1,901 (9.4%) had sustained a right-side impact, and 1,420 (7.0%) had sustained a rear impact. (Fatality Analysis Reporting System, NHTSA, accessed May 2025)
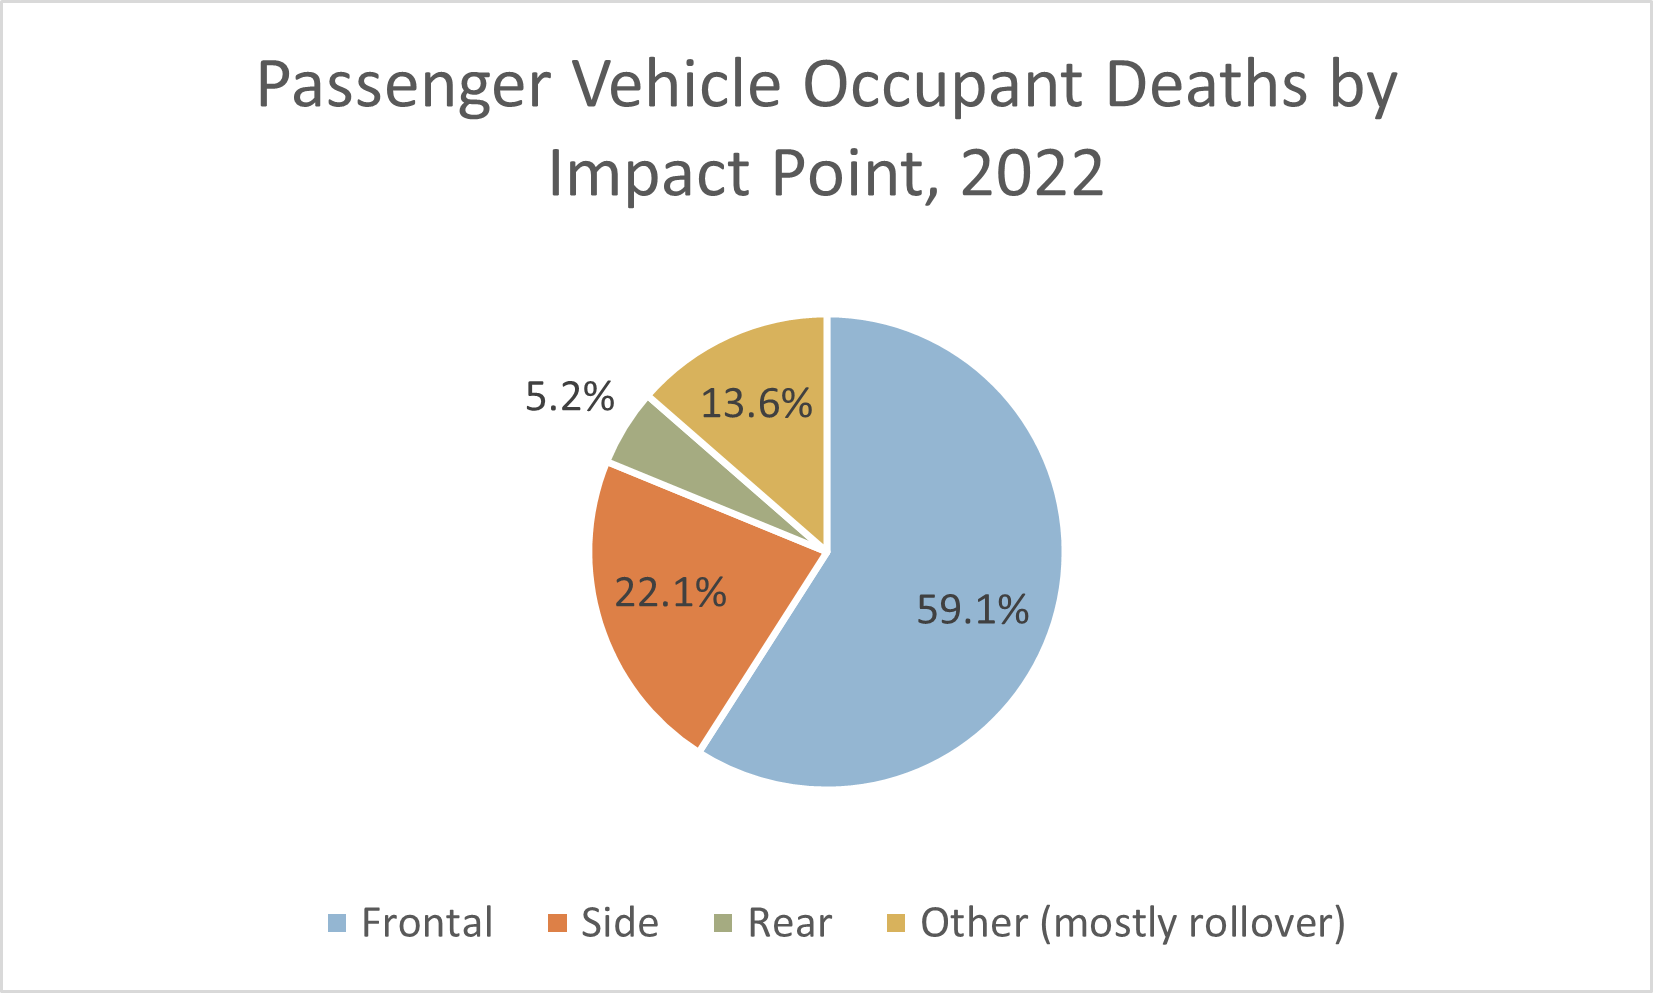
- In 2022, frontal impacts accounted for 59.1% of passenger vehicle occupant deaths. Side impacts accounted for another 22.1% of passenger vehicle occupant deaths. See the following chart. (IIHS, June 2024)
- In 2022, the vast majority (76%) of passenger-vehicle occupants killed in crashes were the drivers. (Unlike NHTSA, IIHS considers “passenger vehicles” as comprising cars, SUVs, and pickup trucks.) For each type of vehicle separately, 73% of SUV occupant fatalities, 76% of car occupant fatalities, and 81% of pickup truck occupant fatalities were the drivers themselves. Just 7% of passenger vehicle occupants killed were passengers in the second or third row of the vehicle; 29% of these passengers were under 13 years of age. (IIHS, June 2024)
- In 2022, there were 25,807 light trucks involved in fatal crashes, representing 41.9% of all motor vehicles involved in fatal traffic crashes. 54.7% of these light trucks were SUVs, 37.3% were light pickup trucks, and 7.9% were vans and minivans. (NHTSA considers “light trucks” as including SUVs and light vans as well as light pickup trucks.) (NHTSA, December 2024)
- Of the 25,911 light trucks involved in fatal crashes in 2022, 17,179 (66.3%) of the light trucks had sustained a front-impact crash with another moving motor vehicle. 2,261 (8.7%) of the trucks had sustained a left-side impact, 1,310 (5.1%) of the trucks had sustained a right-side impact, 1,908 (7.4%) had sustained a rear impact, 3,229 (12.5%) had collisions with fixed objects, and 3,527 (13.6%) had collisions with non-motorists. (Fatality Analysis Reporting System, NHTSA, accessed May 2025)
- Of the 25,911 light trucks involved in fatal crashes in 2022, 16,180 (62.4%) of the trucks were in multiple-vehicle crashes, and 9,731 (37.6%) of the trucks were in single-vehicle crashes. (Fatality Analysis Reporting System, NHTSA, accessed May 2025)
Large truck drivers
- In 2022, there were 503,707 police-reported crashes involving large trucks. These included 5,311 (about 1.1%) fatal crashes and 114,290 (about 22.7%) injury crashes. (Fatality Analysis Reporting System, NHTSA, accessed May 2025)
- In 2022, 21.3% of the fatal crashes involving large trucks, 16.2% of the injury crashes, and 22.0% of the property-damage-only crashes were single-vehicle crashes. (Fatality Analysis Reporting System, NHTSA, accessed May 2025)
- In 2022, 4,764 people died in crashes involving large trucks, up 1.1% from 2021. 17% of these deaths were truck occupants, 66% were passenger vehicle occupants, and 16% were pedestrians, bicyclists, and motorcyclists. (IIHS, August 2024)
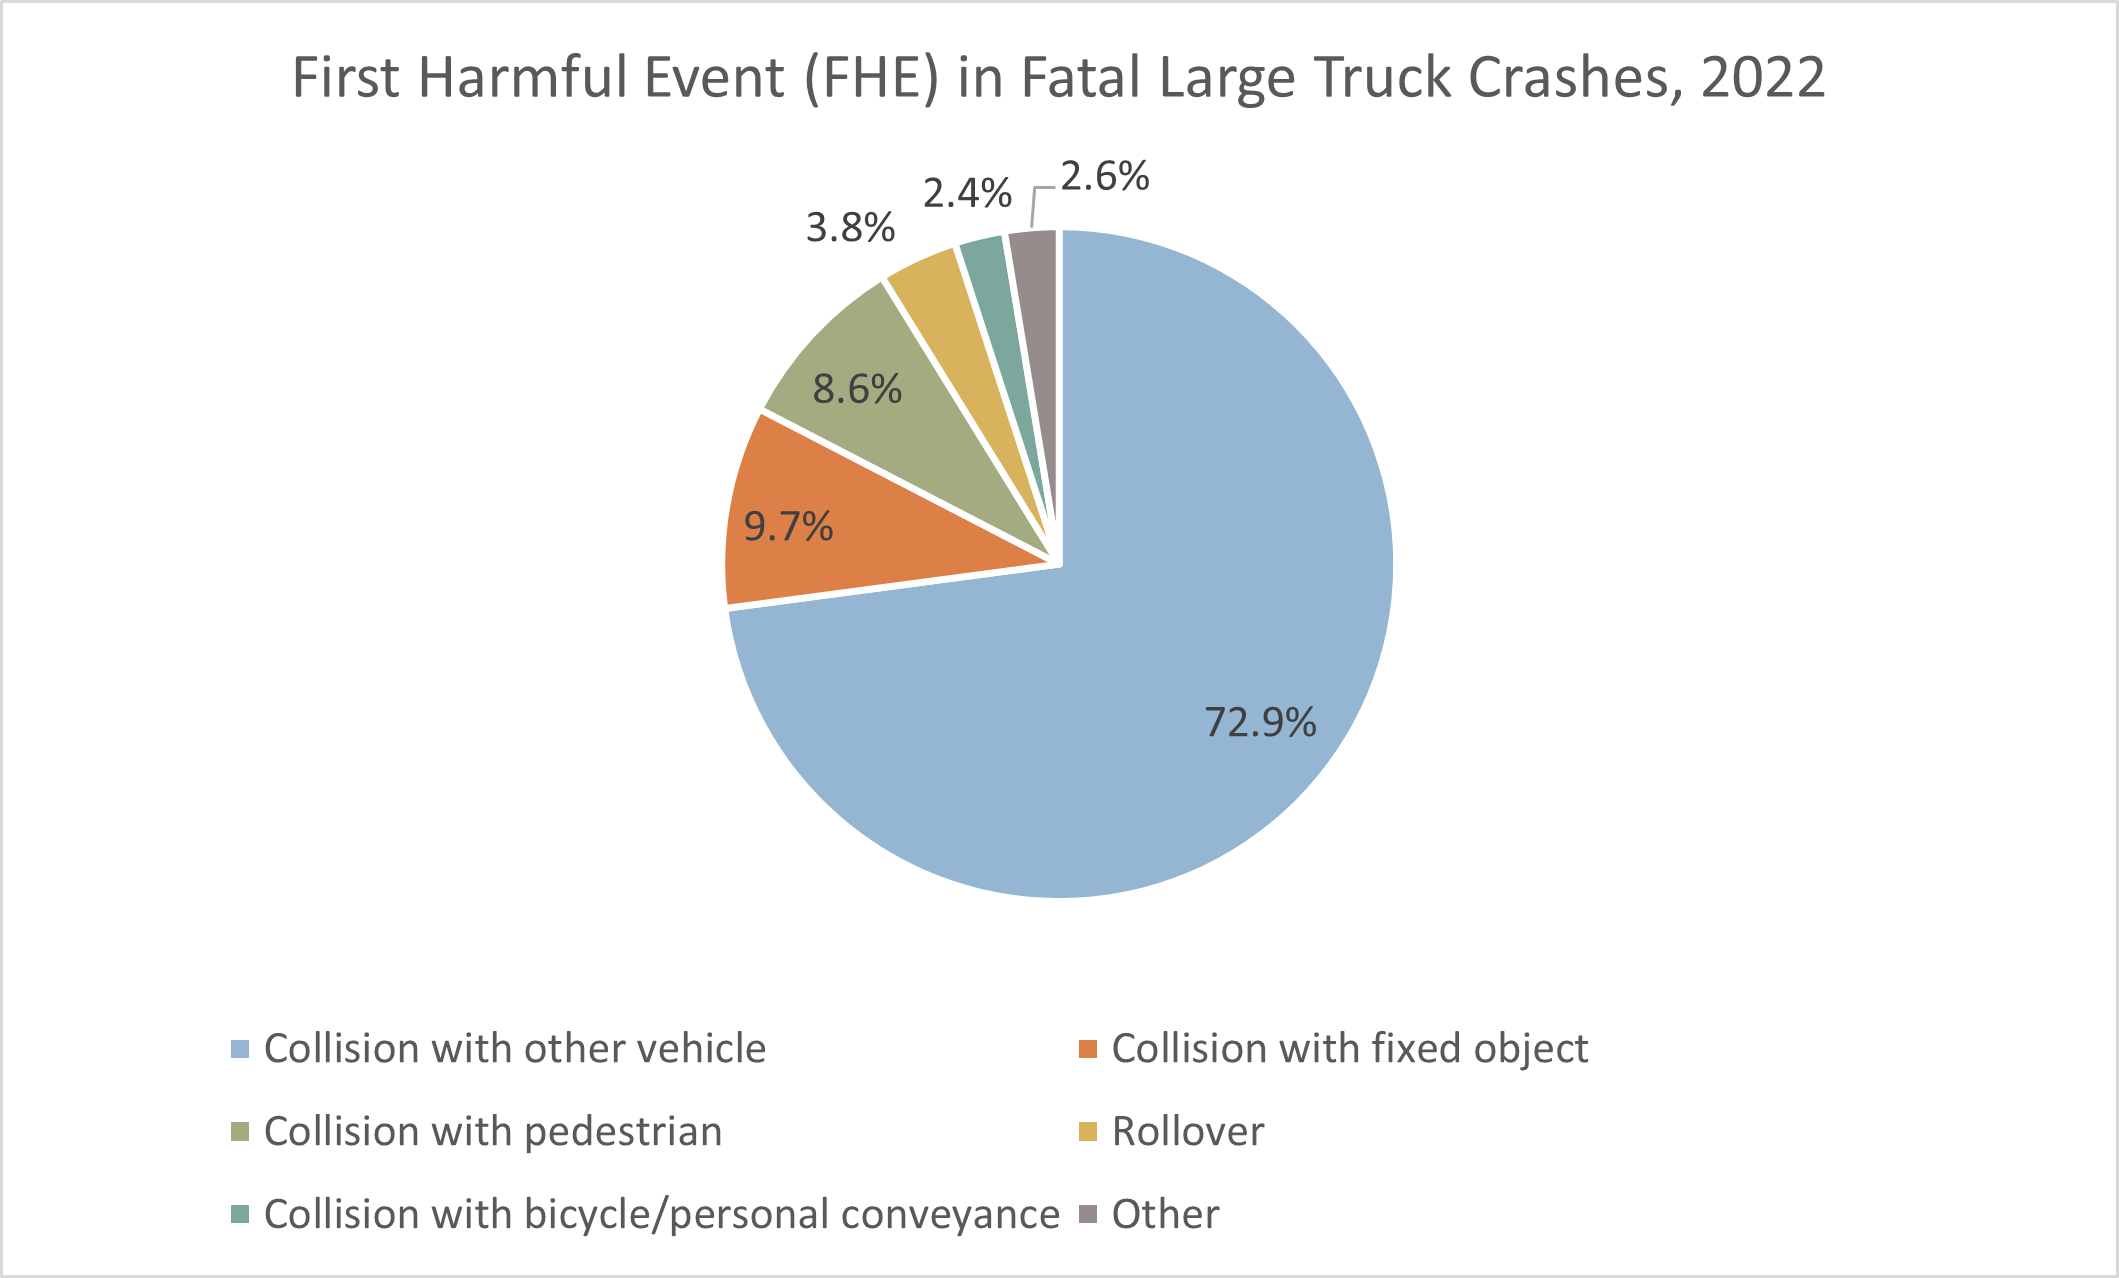
- In 2022, the first harmful event precipitating 72.9% of the fatal large-truck crashes was a collision with another moving motor vehicle. 9.7% of the fatal large-truck crashes were precipitated by a collision with a fixed object. 8.6% were collisions with pedestrians. 3.8% were rollovers. 2.4% were collisions with a bicycle or other personal conveyance. Only 0.2% were precipitated by jackknives. See the following chart. (Fatality Analysis Reporting System, NHTSA, accessed May 2025)
- In 2022, large trucks accounted for 9.6% of the vehicles in fatal traffic crashes but only 3.9% of the vehicles involved in injury crashes and 5.5% of the vehicles involved in property-damage-only crashes. 64.4% of the large trucks involved in fatal crashes were combination trucks (semi-trucks or tractor-trailers). (NHTSA, December 2024)
- In 2022, 96% of vehicle occupants killed in two-vehicle crashes involving a passenger vehicle and a large truck were occupants of the passenger vehicle. Only 4% were occupants of the large truck. (IIHS, June 2024)
- Among occupants of large trucks who died in multiple-vehicle crashes in 2022, about 61% of them died in collisions involving at least one other large truck. (IIHS, June 2024)
- In 2022, about 73% of deaths in large truck crashes were in crashes involving a tractor-trailer, and 28% were in crashes involving a single-unit truck. In about 1% of crashes, the type of large truck was unknown. These figures sum to about 102% because some large truck crashes involved both a tractor-trailer and a large single-unit truck. (IIHS, June 2024)
- The rate of occupant deaths in large truck crashes per 100 million truck miles traveled has declined substantially since 1975. In 1975, the rate was 1.13 large truck occupant fatalities per 100 million truck miles traveled. By 2020, the rate had declined to 0.20 large truck occupant fatalities per 100 million truck miles traveled. However, there followed a moderate uptick to 0.25 large truck occupant deaths per 100 million truck miles traveled in 2022. (IIHS, June 2024)
- Among passenger vehicle occupant deaths in crashes involving a large truck in 2022, the most common types of fatal crashes were as follows (IIHS, June 2024):
- Large truck hit passenger vehicle head-on: 32%
- Large truck hit side of passenger vehicle: 25%
- Passenger vehicle rear-ended large truck: 21%
- Passenger vehicle hit side of large truck: 12%
- Large truck rear-ended passenger vehicle: 6%
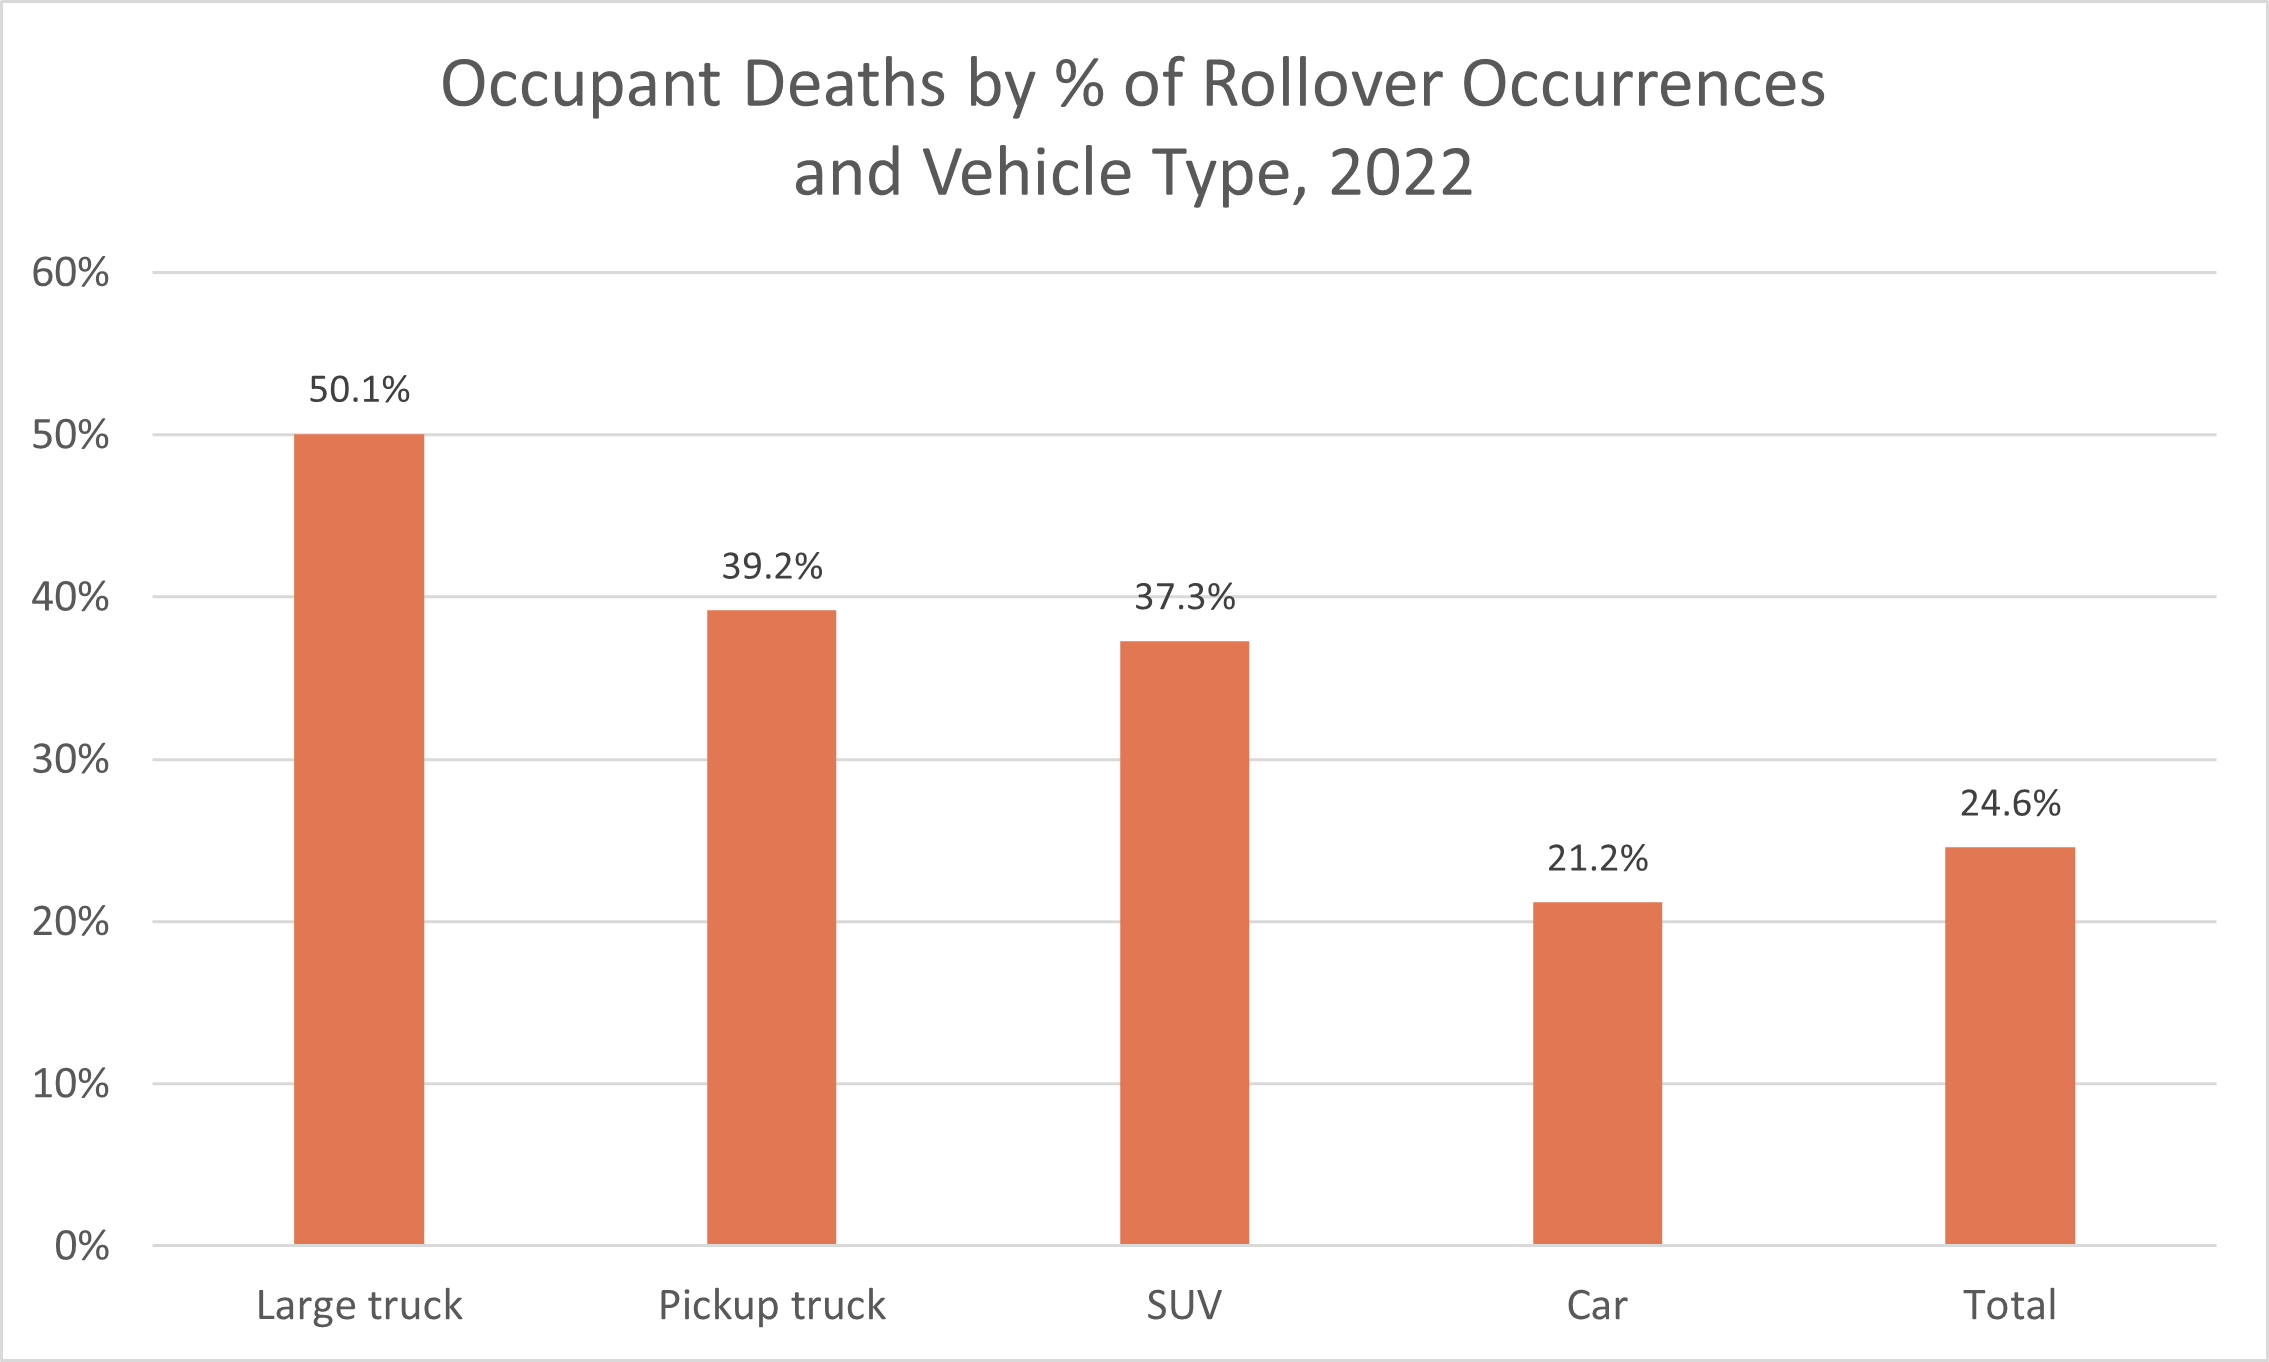
- In 2022, 50.1% of large truck occupant deaths occurred in rollovers. This was a higher percentage than for occupant deaths in other common types of motor vehicles. See the following chart. (IIHS, June 2024)
Bus drivers
- In 2021, there were 204 fatal crashes involving buses, including 80 crashes involving school buses, 78 involving transit buses, 17 involving coach buses, and 22 involving other types of buses; the rest were unknown. These crashes resulted in a total of 221 fatalities, of which only 15 were occupants of the buses. Of these 15 occupants who died, 8 were occupants of school buses, 4 were occupants of transit buses, none were occupants of coach buses, and the other 3 were occupants of other types of buses. (FMCSA, November 2023)
- Of the 205 buses involved in fatal crashes in 2021, 80 (39.0%) of the buses had sustained front-impact crashes with another moving motor vehicle. 16 (7.8%) of the buses had sustained left-side impacts, 11 (5.4%) of the buses had sustained right-side impacts, 35 buses (17.1%) had sustained rear impacts, one bus (0.5%) had a collision with a fixed object, and 52 buses (25.4%) had collisions with non-motorists. (Fatality Analysis Reporting System, NHTSA, January 2024)
- Of the 205 buses involved in fatal crashes in 2021, 150 (73.2%) were in multiple-vehicle crashes, and 55 (26.8%) were in single-vehicle crashes. (Fatality Analysis Reporting System, NHTSA, January 2024)
- The rate of fatal bus crashes per 100 million vehicle miles traveled (VMT) has trended downward since the mid-1980s. In 1985, there were 2.11 fatal bus crashes per 100 million VMT. In 2019, there were 0.99 fatal bus crashes per 100 million VMT. There was an uptick in 2020–2021, reaching 1.22 fatal bus crashes per 100 million VMT, which was still well below the rate in 1985. (FMCSA, November 2023)
Motorcyclists
- More than half of all road traffic deaths worldwide are among pedestrians, cyclists, and motorcyclists. (WHO, accessed April 2025)
- In 2022, 6,222 motorcyclists were killed in crashes, nearly triple the number in 1997. This is the highest number of motorcyclist fatalities since NHTSA started collecting this data in 1975. (IIHS, December 2024)
- Per 100 million vehicle miles traveled (VMT), the fatality rate for motorcyclists (26.16) was 21.8 times the passenger car occupant fatality rate (1.20) and 36.3 times the fatality rate for light-truck occupants (0.72). (NHTSA defines “motorcyclists” as including both motorcycle operators and motorcycle passengers.) (NHTSA, July 2024)
- In 2022, most motorcycle fatalities occurred under the following conditions: (NHTSA, July 2024; and National Safety Council, 2025)
- On non-interstate roads (92%)
- On urban roads (66%)
- At non-intersection locations (64%)
- In good weather (94%)
- In the daytime (58%)
- In two-vehicle crashes (55%)
- When the motorcyclist was wearing a helmet (59%)
- When the motorcycle rider was not impaired by alcohol (72%)
- In 2022, motorcycles accounted for only 3.5% of all registered vehicles and only 0.7% of all vehicle miles traveled but 15% of all traffic fatalities. (NHTSA, July 2024)
- Of the 6,218 motorcyclists killed in traffic crashes in 2022, 5,934 (95.4%) were riders and 284 (4.6%) were passengers. (NHTSA, July 2024)
- Of the 6,359 motorcycles involved in fatal crashes in 2022, 2,531 (43.5%) had sustained front-impact crashes with another moving motor vehicle. 240 (3.8%) of the motorcycles had sustained left-side impacts, 165 (2.6%) of the motorcycles had sustained right-side impacts, 274 (4.3%) had sustained rear impacts, 1,548 (24.3%) had collisions with fixed objects, and 60 (0.9%) had collisions with non-motorists. (Fatality Analysis Reporting System, NHTSA, accessed April 2025)
- Of the 6,359 motorcycles involved in fatal crashes in 2022, 3,980 (62.6%) were in multiple-vehicle crashes, and 2,379 (37.4%) were in single-vehicle crashes. (Fatality Analysis Reporting System, NHTSA, accessed April 2025)
- In 2022, there were 3,268 fatal two-vehicle crashes involving a motorcycle and another type of vehicle. In 1,436 (43.9%) of these crashes, the other vehicle was turning left while the motorcycle was going straight, passing, or overtaking other vehicles. In 616 (18.8%) of fatal two-vehicle crashes, both vehicles were going straight. (NHTSA, July 2024)
- Motorcycles have been more frequently involved in fatal collisions with fixed objects than other vehicle types have been. In 2022, 24% of motorcycles involved in fatal crashes had collided with fixed objects, compared with 16% for passenger cars, 13% for light trucks, and 5% for large trucks. (NHTSA, July 2024)
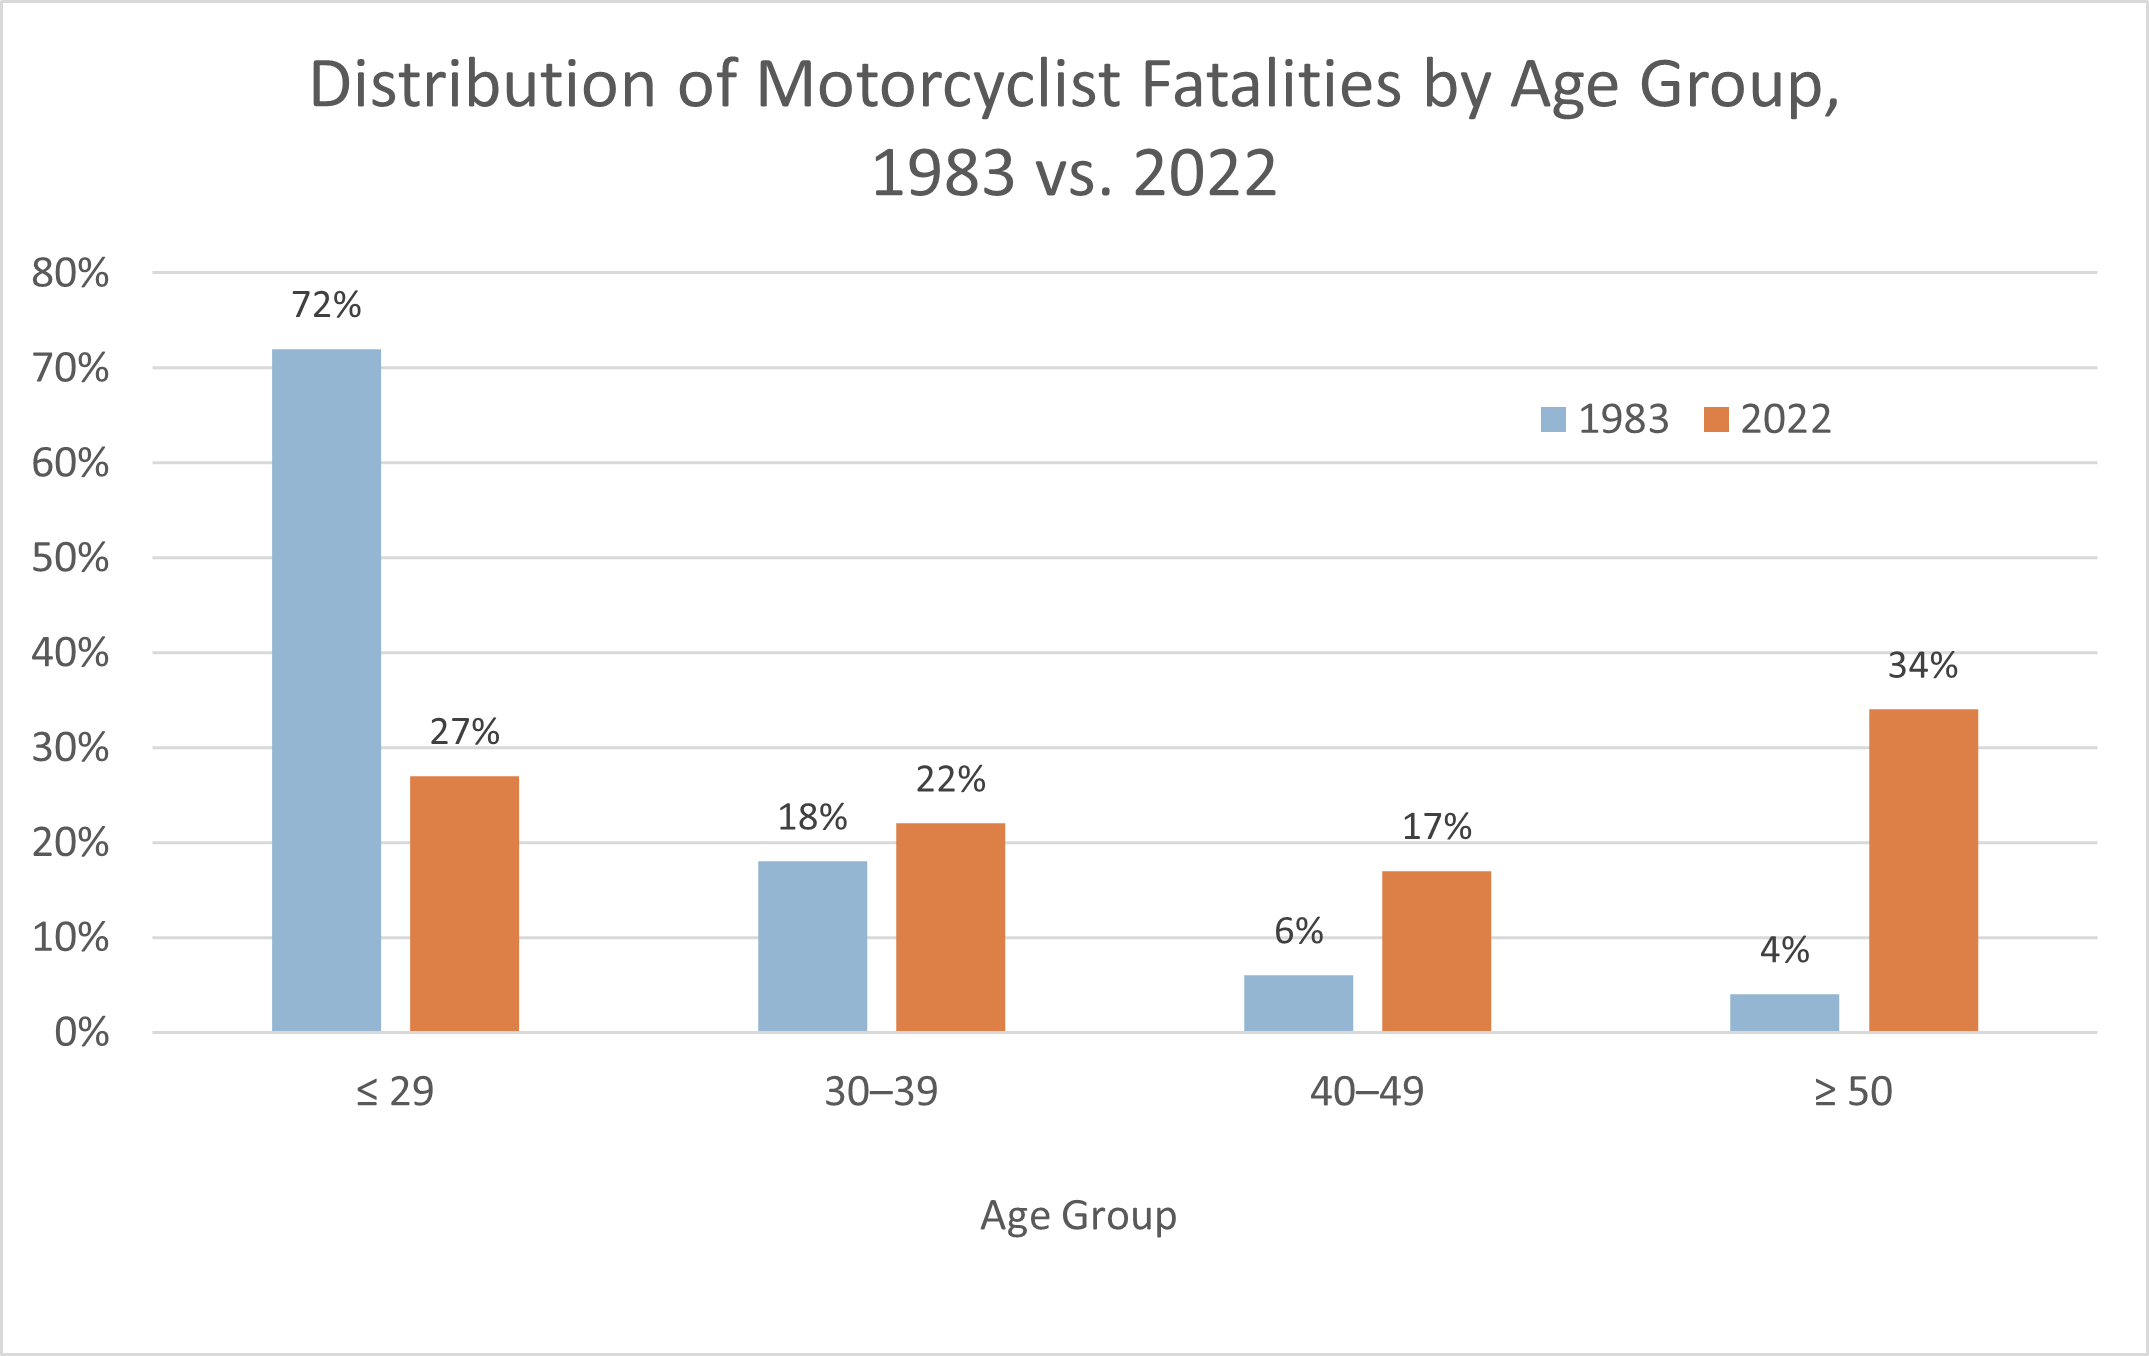
- The age distribution of motorcyclists killed in crashes has shifted dramatically in the last 40 years or so. Motorcyclists under age 30 accounted for 72% of motorcyclist fatalities in 1983 but just 27% in 2022. Motorcyclists aged 50 and older accounted for just 4% of motorcyclist fatalities in 1983 but 34% in 2022. See the following chart. (IIHS, December 2024)
- Among motorcycle drivers who died in crashes in 2022, 34% were riding motorcycles with engine sizes larger than 1,400 cubic centimeters (cc), compared with 9% in 2000 and less than 1% in 1990. (IIHS, June 2024)
- Among motorcycle drivers who died in traffic crashes in 2022, 26% were riding motorcycles with engine sizes of 1,501 cc or higher, 22% were riding motorcycles with engine sizes of 1,001 to 1,500 cc, 35% were riding motorcycles with engine sizes of 501 to 1,000 cc, and 11% were riding motorcycles with engine sizes up to 500 cc. (NHTSA, July 2024)
- In 2022, 46.1% of motorcyclist deaths occurred on weekends (i.e., between 6 p.m. on Friday and 6 a.m. on Monday). 25.8% of those weekend deaths occurred between 6 p.m. and 9 p.m., more than during any other three-hour period. (IIHS, June 2024)
Bicyclists
- More than half of all road traffic deaths worldwide are among vulnerable road users, such as pedestrians, bicyclists, and motorcyclists. (WHO, accessed April 2025)
- In motor vehicle crashes in the United States in 2022, 7,522 pedestrians and 1,084 bicyclists were killed and approximately 67,000 pedestrians and 46,195 bicyclists were injured. Approximately 18% of total traffic fatalities were pedestrians, and another 2% were bicyclists. (IIHS, August 2024)
- By 2022, bicyclist deaths were 8% higher than in 1975, but they had increased by about 75% since reaching their lowest point in 2010. 89% of bicyclist deaths in 2022 were among those aged 20 and older. Deaths among bicyclists younger than 20 have declined by 88% since 1975, while deaths among bicyclists 20 and older have nearly quintupled. In every year since 1975, many more male than female bicyclists were killed in crashes with motor vehicles. (IIHS, August 2024)
- In 2022, 89% of bicyclists killed in crashes were aged 20 or older. (IIHS, August 2024)
- A 2018 review of more than 7,000 bicyclist crashes in California’s San Francisco Bay Area found that the crash rate per person per distance traveled for Black bicyclists was nearly eight times that of white bicyclists. The rate for Hispanic bicyclists was 2.5 times that of white bicyclists. (University of Illinois, 2018)
- In 2022, bicyclist deaths were highest (21% of an average day’s total) from 6 p.m. to 9 p.m. (IIHS, August 2024)
- The proportion of bicyclist fatalities in urban areas has risen sharply in recent decades. In 1975, 50% of deaths occurred in urban areas and 50% in rural areas. In 2022, 83% occurred in urban areas and only 17% in rural areas. (IIHS, August 2024)
- In 2022, 34% of bicyclist fatalities occurred at intersections; nearly twice as many (66%) occurred at other locations. (IIHS, August 2024)
- In 2022, 64% of bicyclist deaths occurred on major roads other than interstates and freeways, and 31% occurred on minor roads. That same year, 66% of the deaths of bicyclists ages 20 and older occurred on major roads, compared with 53% of the deaths of bicyclists under 20 years of age. (IIHS, June 2024)
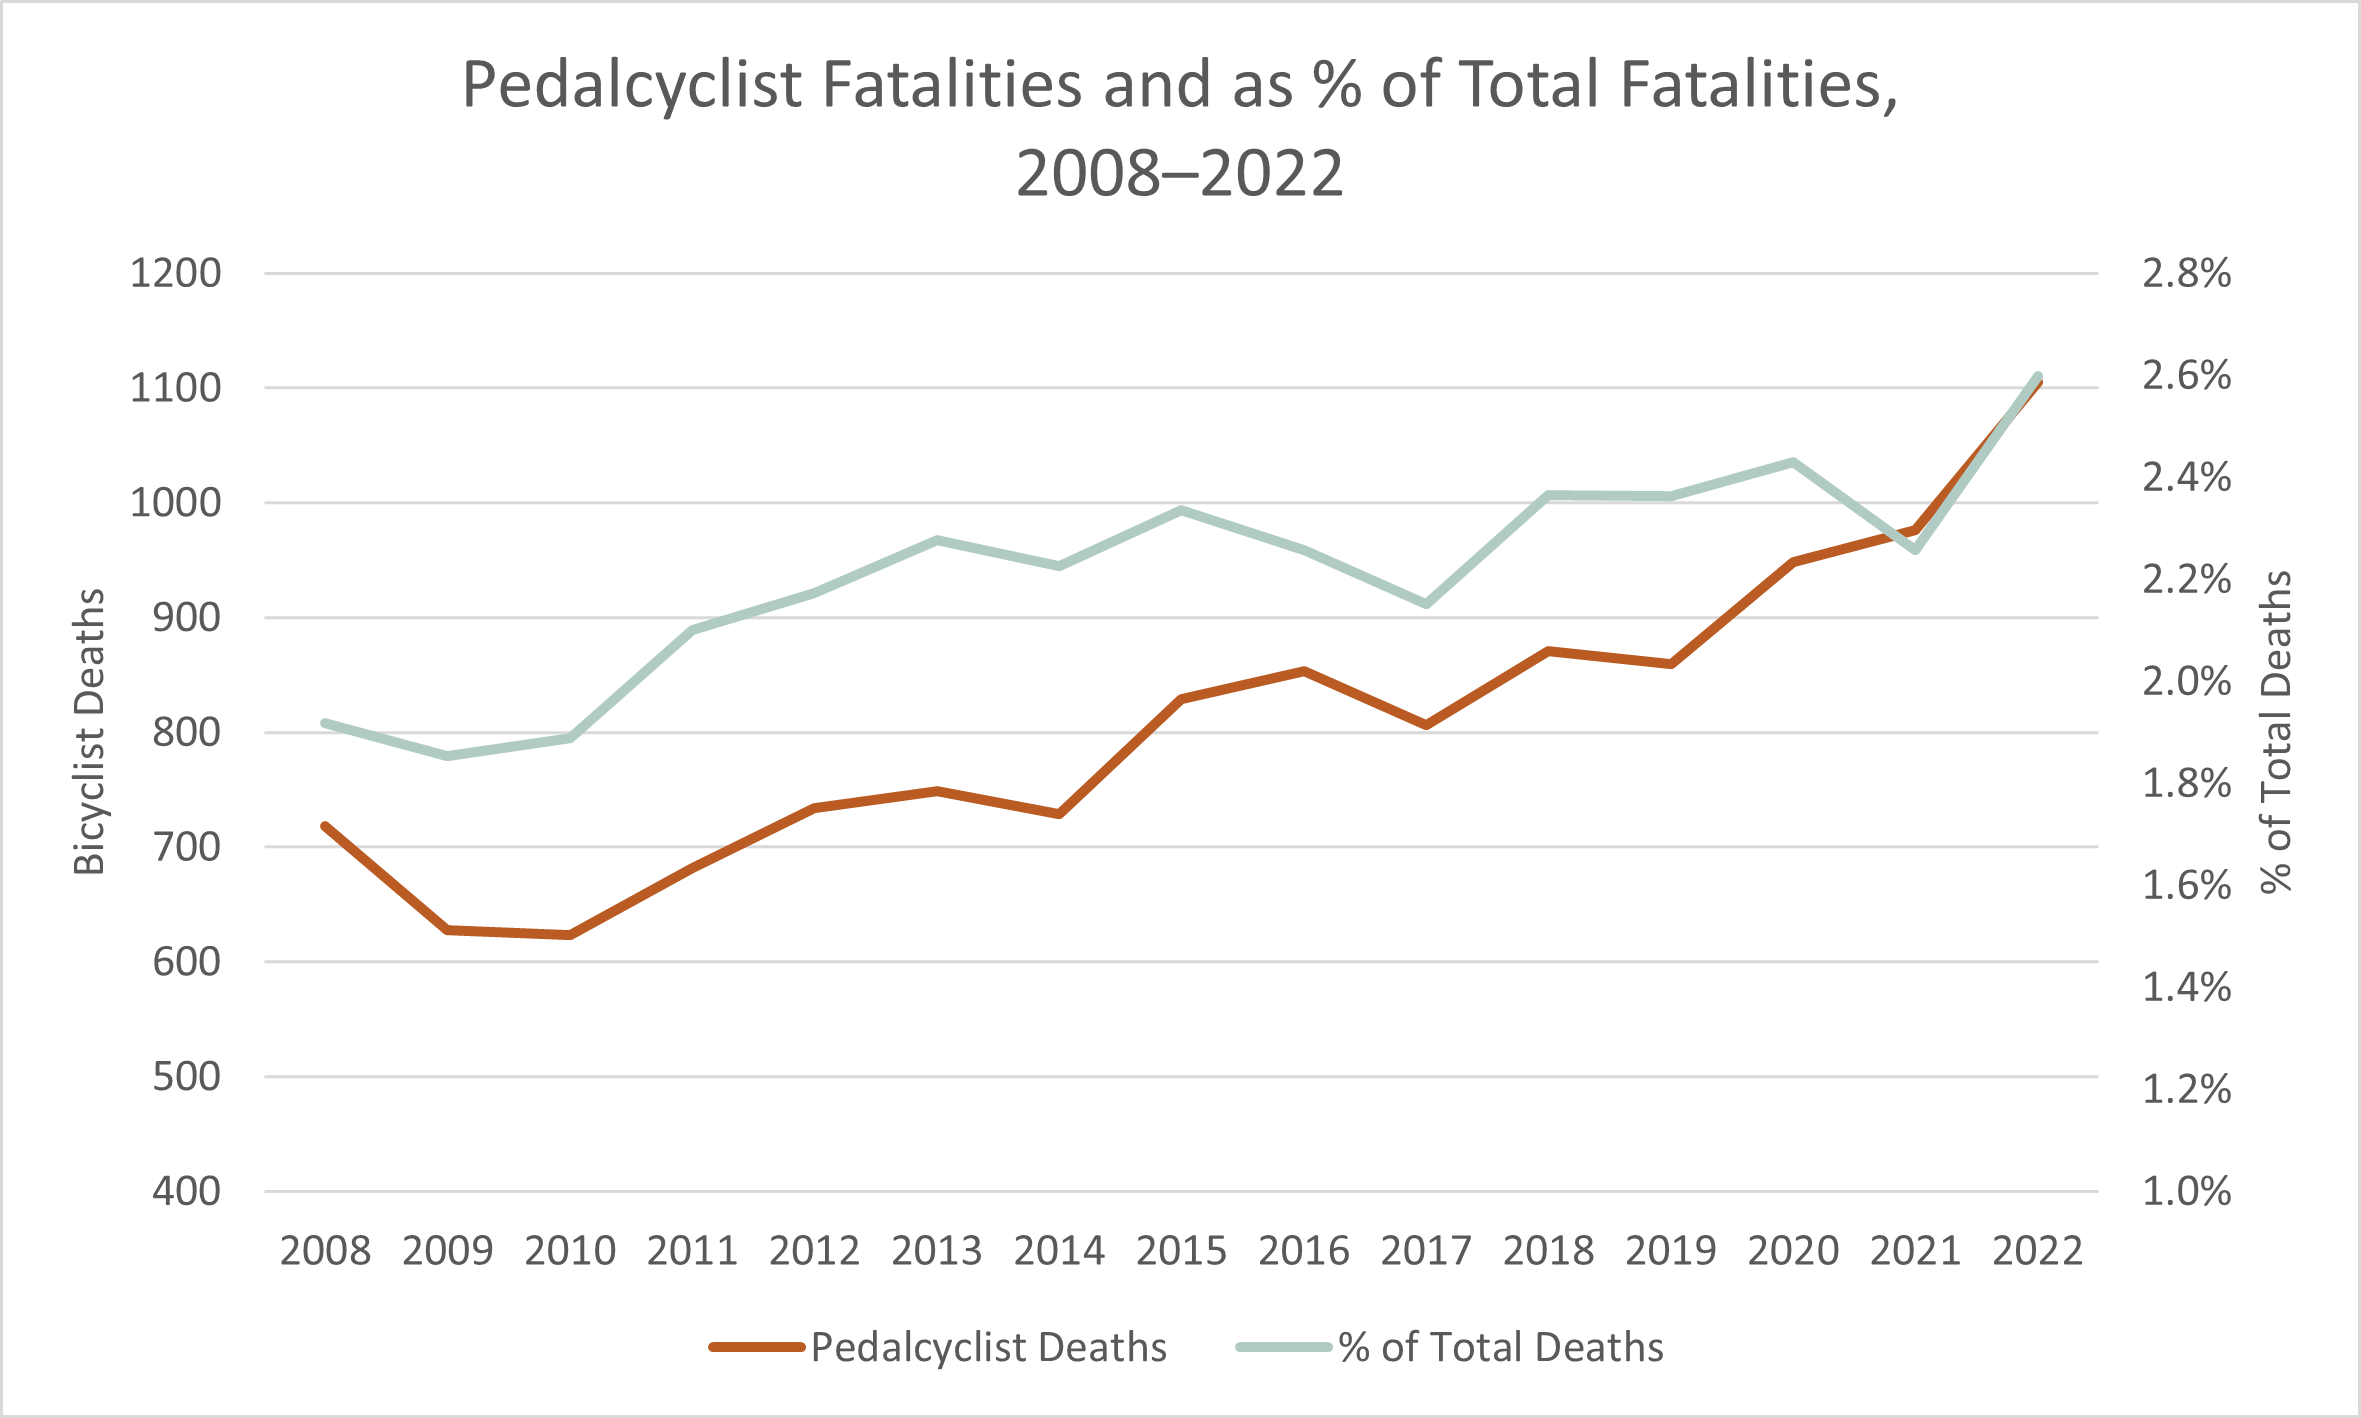
- Pedalcyclist crash fatalities have been in a long-term uptrend. In 2022, bicyclist crash fatalities reached an all-time high of 1,105, making up 2.6% of all traffic fatalities (also an all-time high). (Note that part of the increase in 2022 may have been due to the inclusion of motorized bicycles as bicycles, from that year onward. However, even if you exclude 2022 from consideration, pedalcyclist deaths were still in an uptrend through 2021.) From 2018 through 2022, an average of 952 bicyclists were killed in traffic crashes each year. See the following chart. (In this context, NHTSA considers a “pedalcyclist” someone who rides a pedal-powered bicycle, tricycle, or unicycle.) (Fatality Analysis Reporting System, NHTSA, accessed April 2025)
- In 2022, 46% of bicyclist fatalities occurred as the result of collisions with SUVs, pickup trucks, and vans – more fatalities than from any other cause. (Fatality Analysis Reporting System, NHTSA, accessed April 2025)
- In 2022, 21% of bicyclists ages 16 and older who were killed in crashes had a blood alcohol concentration (BAC) of 0.08% or higher. (0.08% is the threshold for legal intoxication.) (IIHS, August 2024)
- As of August 2024, 21 states and Washington, DC had state laws requiring young bicyclists to wear helmets, although the maximum required age varied among these states. In other states, some individual cities or communities required young bicyclists to wear helmets. No state required adult bicyclists to wear helmets. (IIHS, August 2024)
Pedestrians
- In 2022, 7,522 pedestrians were killed in traffic crashes. An estimated 67,336 pedestrians were injured. 70% of the pedestrians killed were males. (NHTSA, July 2024) This percentage has varied only slightly since 1975. (IIHS, August 2024)
- In 2022, 18% of traffic fatalities and 3% of traffic injuries were pedestrians. (NHTSA, July 2024) In 2000–2009, pedestrian fatalities represented about 11% of traffic crash fatalities, but this percentage increased since then. (AAA Foundation for Traffic Safety, January 2025)
- In 2022, 88% of pedestrian fatalities occurred in single-vehicle crashes. 22% of pedestrian fatalities were caused by hit-and-run drivers. (NHTSA, July 2024)
- The rate of pedestrian deaths per 100,000 people decreased from 3.48 in 1975 to 2.26 in 2022, a drop of about 35.1%. The pedestrian death rate for children ages 0–12 decreased by a remarkable 92%. Children of these ages had the second-highest pedestrian death rate (3.56; after seniors ages 70 and older) in 1975 but the lowest (0.28) in 2022. Pedestrians ages 70 and older had the highest death rate from 1975 through 2017, but their death rate declined by 72.5% from 1975 to 2022. In 2022, the death rate of pedestrians ages 70 and older was lower than the death rate of pedestrians ages 20–69. (IIHS, June 2024)
- In 2022, pedestrian deaths accounted for about 17.7% of all motor vehicle crash fatalities. 25.4% of pedestrian deaths occurred in hit-and-run accidents. (IIHS, June 2024)
- 7In 2022, about 37% of pedestrians ages 16 and older who were killed in nighttime crashes in 2022 had blood alcohol concentrations (BACs) of 0.08% or higher (the threshold for legal intoxication). 23% of pedestrians ages 16 and older who were killed in daytime crashes that year also had BACs of 0.08% or higher. (IIHS, June 2024)
- In a study of US pedestrian crashes, the average risk of severe injury to a pedestrian was found to be 10% at 17 mph, 25% at 25 mph, 50% at 33 mph, 75% at 41 mph, and 90% at 48 mph. (IIHS, June 2024)
Fatalities by age
- Worldwide, traffic crashes are the leading cause of death for young people 5–29 years of age. More than 90% of road traffic deaths occur in low- and middle-income countries. Rates of traffic fatalities among children in low- and middle-income countries are typically triple those in high-income countries. (World Health Organization, December 2023)
- Worldwide, two-thirds of traffic fatalities occur among people of working age (ages 18–59). (World Health Organization, December 2023)
- In the United States in 2022, persons aged 21–24 had the highest fatality rate and the highest injury rate per 100,000 population of all age groups. Children aged 5–9 had the lowest fatality rate. (NHTSA, December 2024)
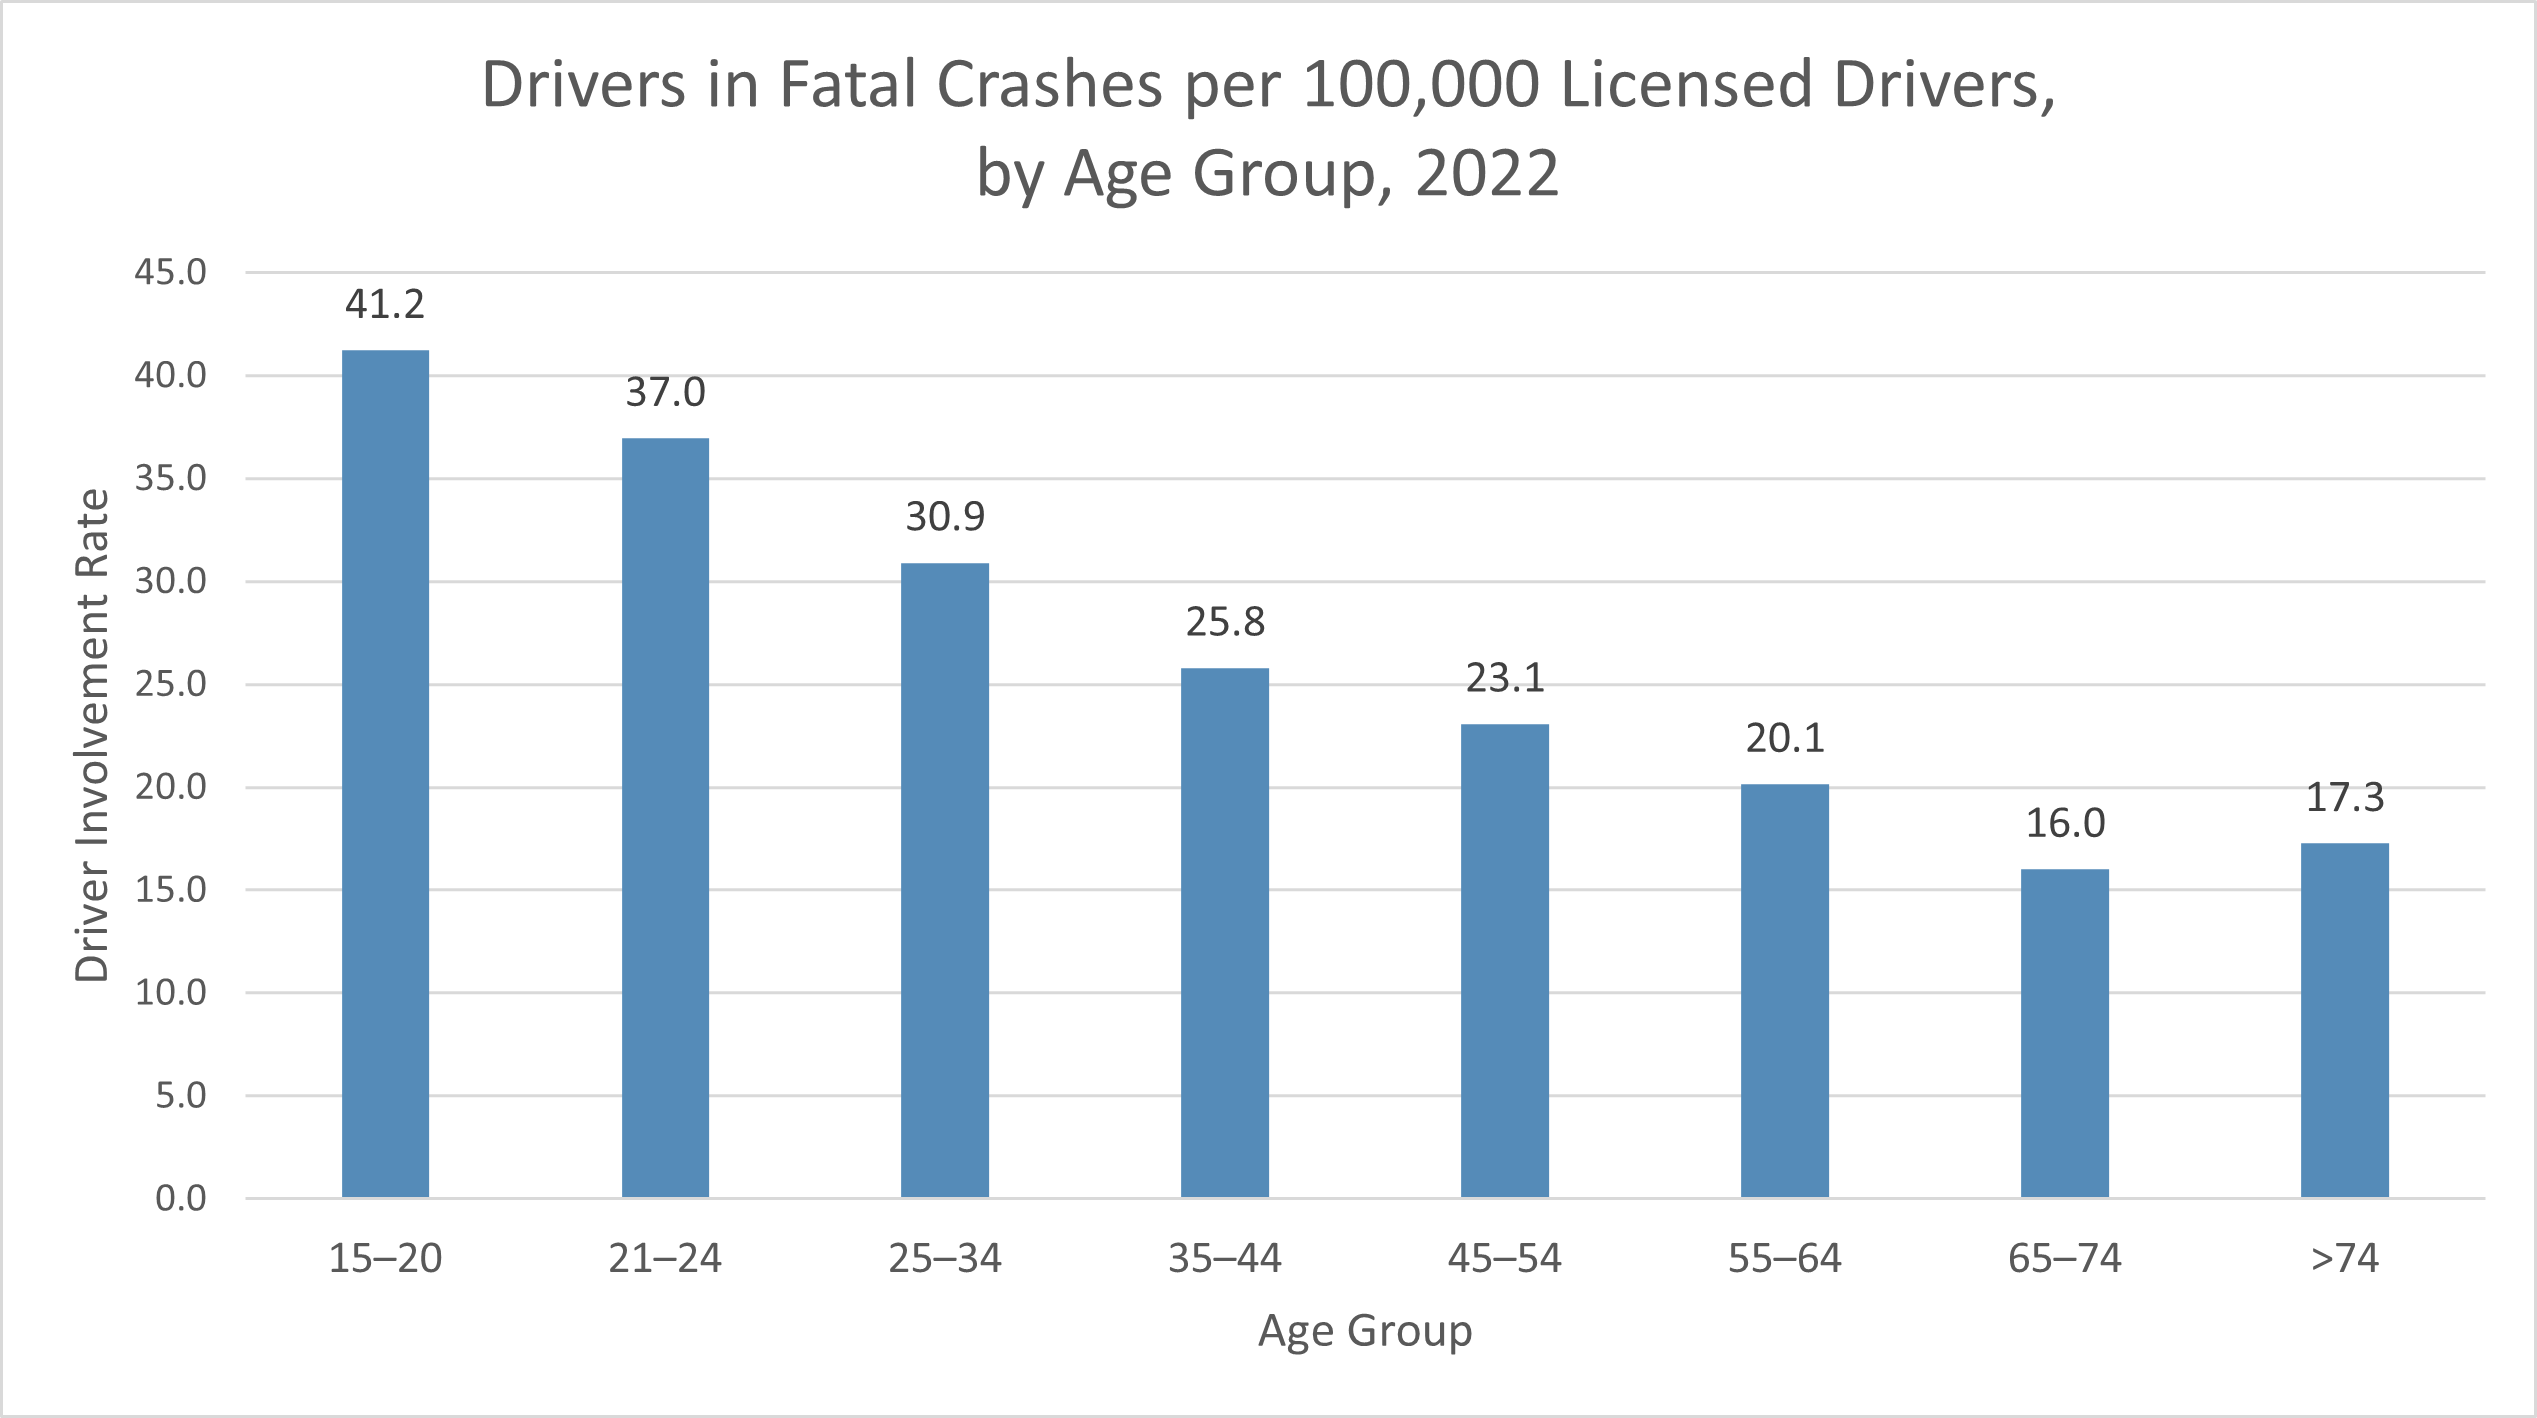
- In the United States in 2022, drivers aged 15–20 had the highest rate of involvement in fatal traffic crashes of all age groups from 15–20 through >74. Drivers aged 65–74 had the lowest rate. See the following chart. (NHTSA, December 2024)
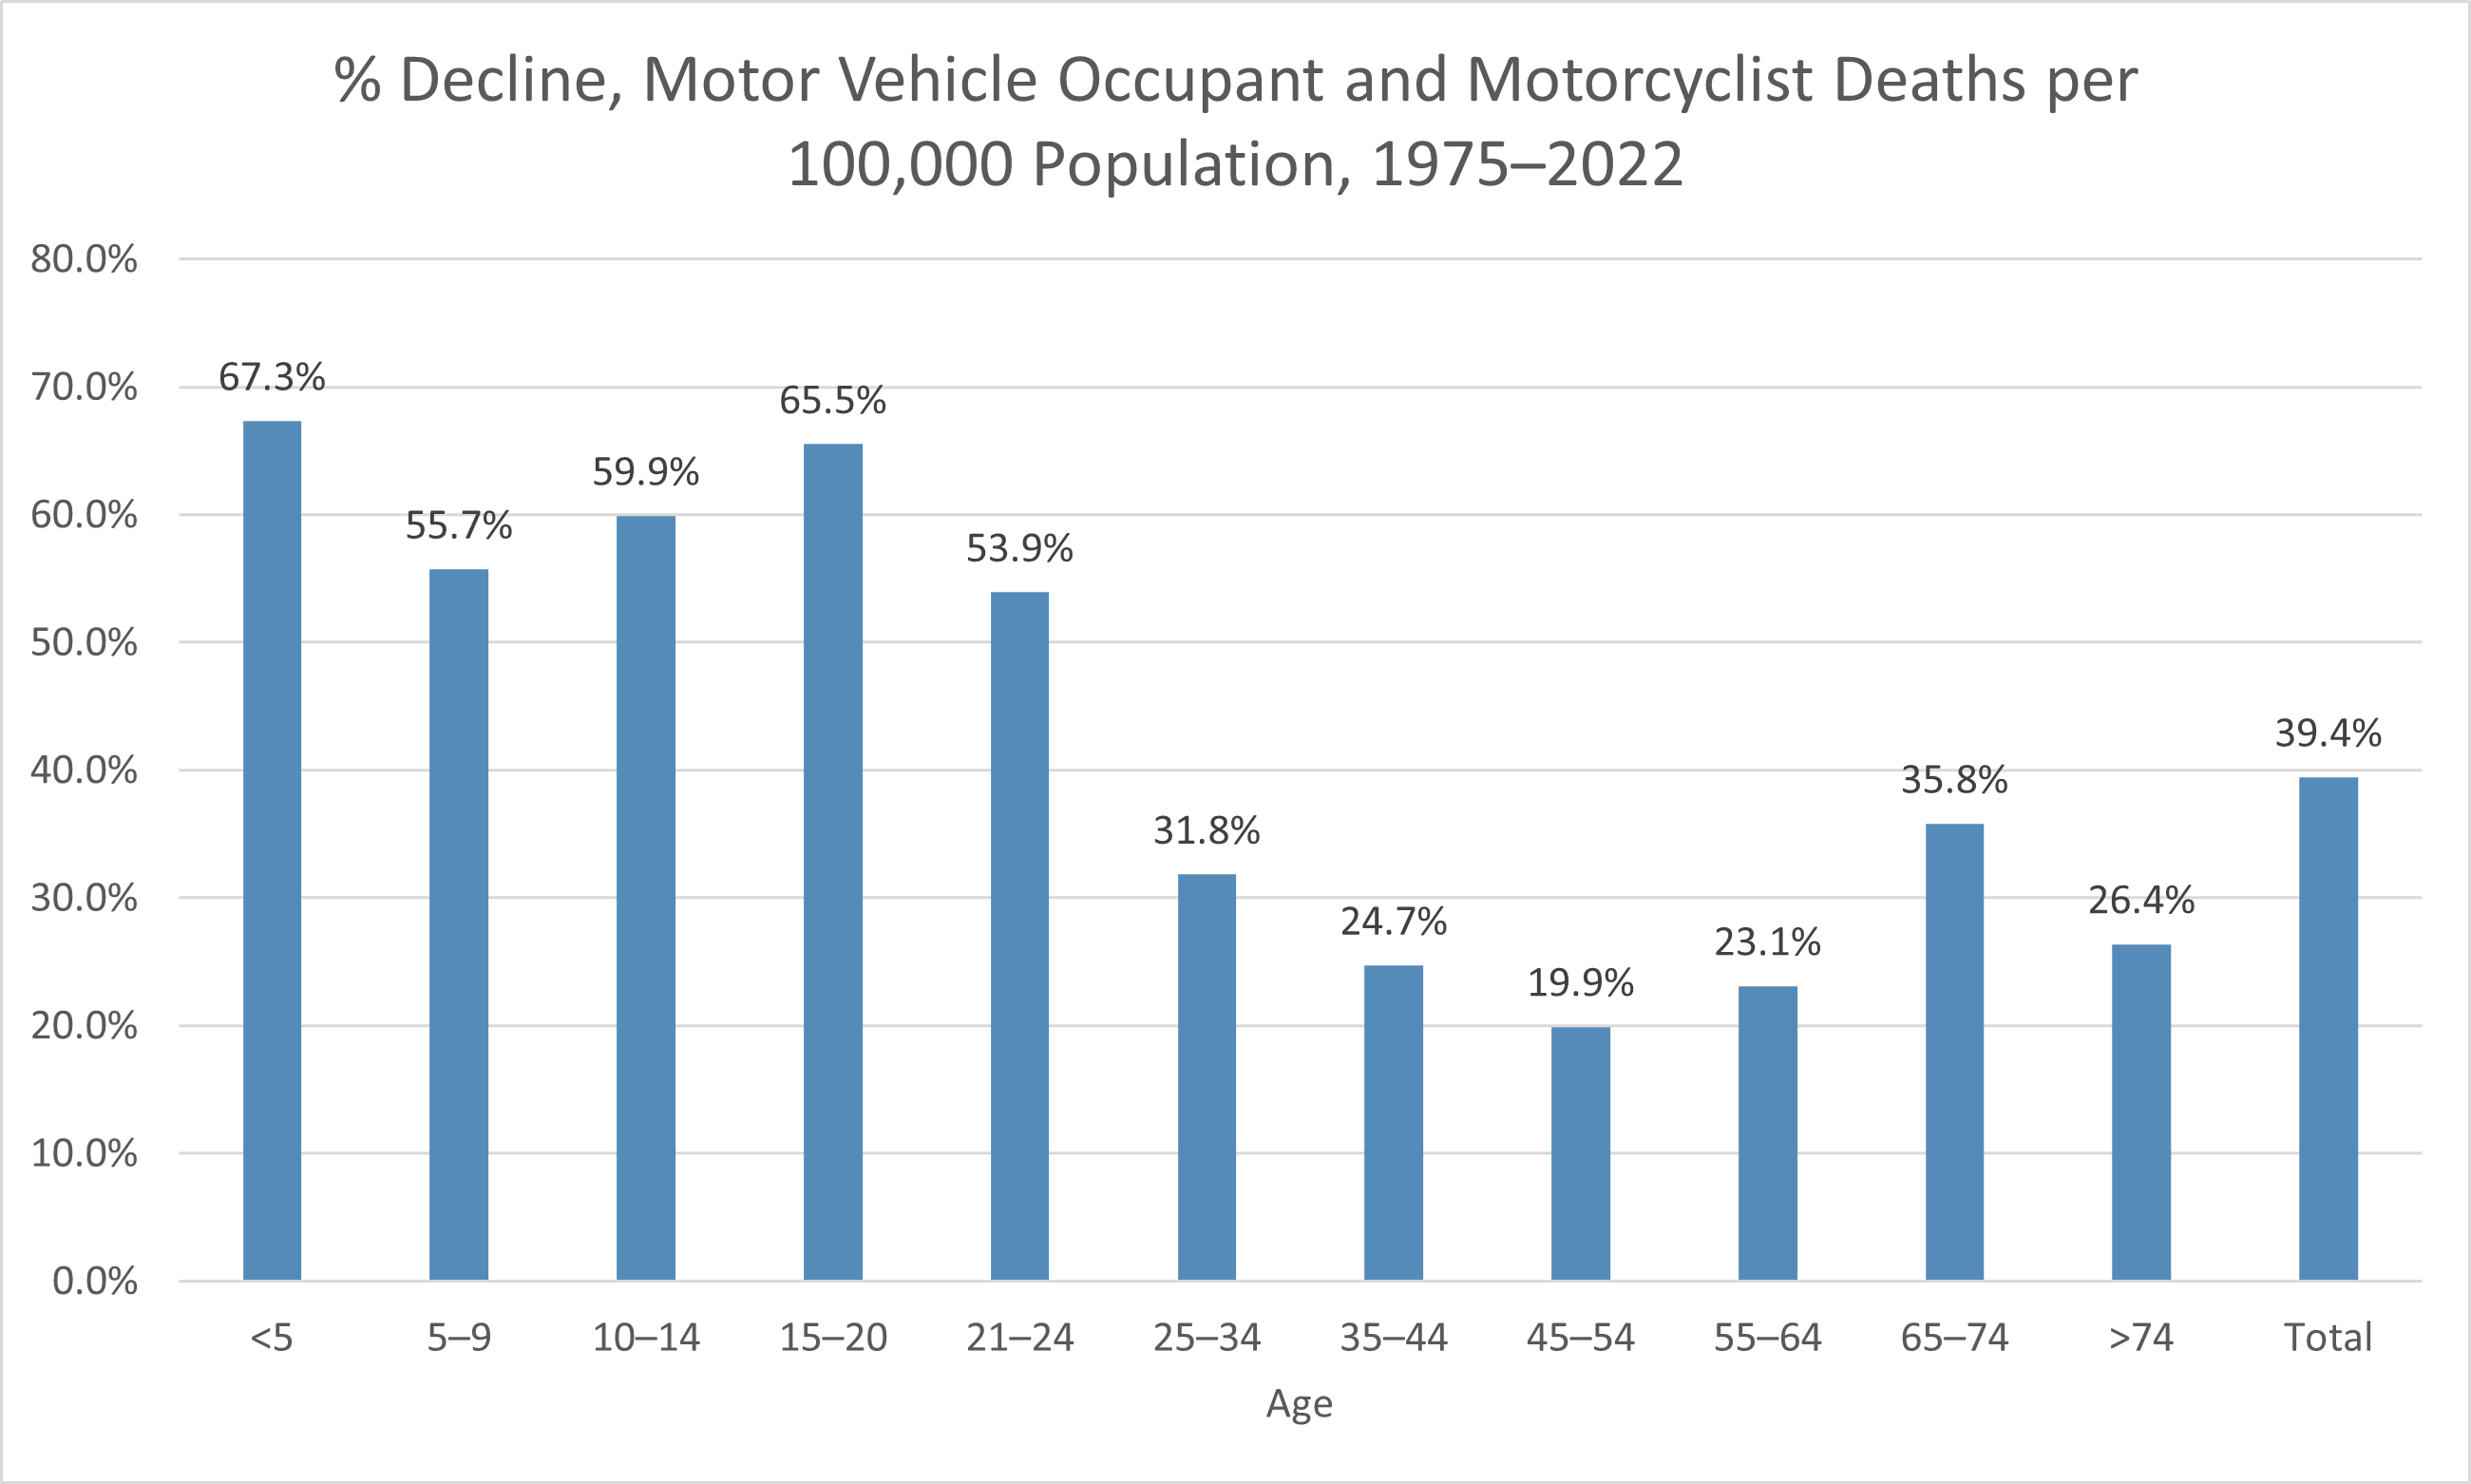
- In the United States, the rate of motor vehicle occupant and motorcyclist deaths per 100,000 population declined by 39.4% from 1975 to 2022. See the following chart. The percentage declines were greatest for persons under 25 and smallest for persons aged 35–64. See the following chart. (NHTSA, December 2024)
- In 2022, 70% of the children who died in traffic crashes were passenger vehicle occupants, 16% were pedestrians, and 3% were bicyclists. The death rate per 100,000 population of pedestrians under 13 years of age had declined by 92% since 1975. The death rate per 100,000 population of bicyclists under 20 years of age had declined by 88% since 1975. (IIHS, January 2025)
- In 2022, 859 children younger than 13 years of age died in motor vehicle crashes. These crashes caused one-fourth of all unintentional fatal injuries to children. Over three-quarters of these deaths were children riding in passenger vehicles. (IIHS, January 2025)
- From 1975 to 2022, the number of child passenger deaths declined by more than half. The rate of child passenger deaths per million children had also fallen sharply to 11.9 deaths per million children in 2022, which represented a 61% reduction from 1975. (IIHS, January 2025)
- The percentage of fatally injured child passengers under 13 who were restrained has risen sharply since 1985 as restraint use has risen generally. In 1985, only 15% of fatally injured children were restrained. In 2022, 58% of children killed in crashes were restrained. (IIHS, January 2025)
- In 2022, 2,883 persons aged 13–19 died in motor vehicle crashes. This is 67% fewer than in 1975 despite a rising US population during that period. About two-thirds of those killed were males. However, crash deaths among males declined by 70% since 1975; crash deaths among females declined by 60%. (IIHS, June 2024)
- In 2022, teenagers accounted for 7% of motor vehicle crash deaths. They comprised 9% of total passenger vehicle occupant deaths, 3% of pedestrian deaths, 4% of motorcyclist deaths, 6% of bicyclist deaths, and 13% of all-terrain vehicle (ATV) rider deaths. (IIHS, June 2024)
- In 2022, motor vehicle crashes were the leading cause of death for female teenagers (suicide was second). Motor vehicle crashes were the second leading cause of death (after homicide) for male teenagers. (IIHS, June 2024)
- In 2022, 3,434 persons (not just drivers) 15–20 years of age were killed and 20,010 persons suffered incapacitating injuries in motor vehicle crashes. Still, it was persons aged 25–34 who suffered the most deaths and incapacitating injuries. See the following chart. (NHTSA, December 2024)
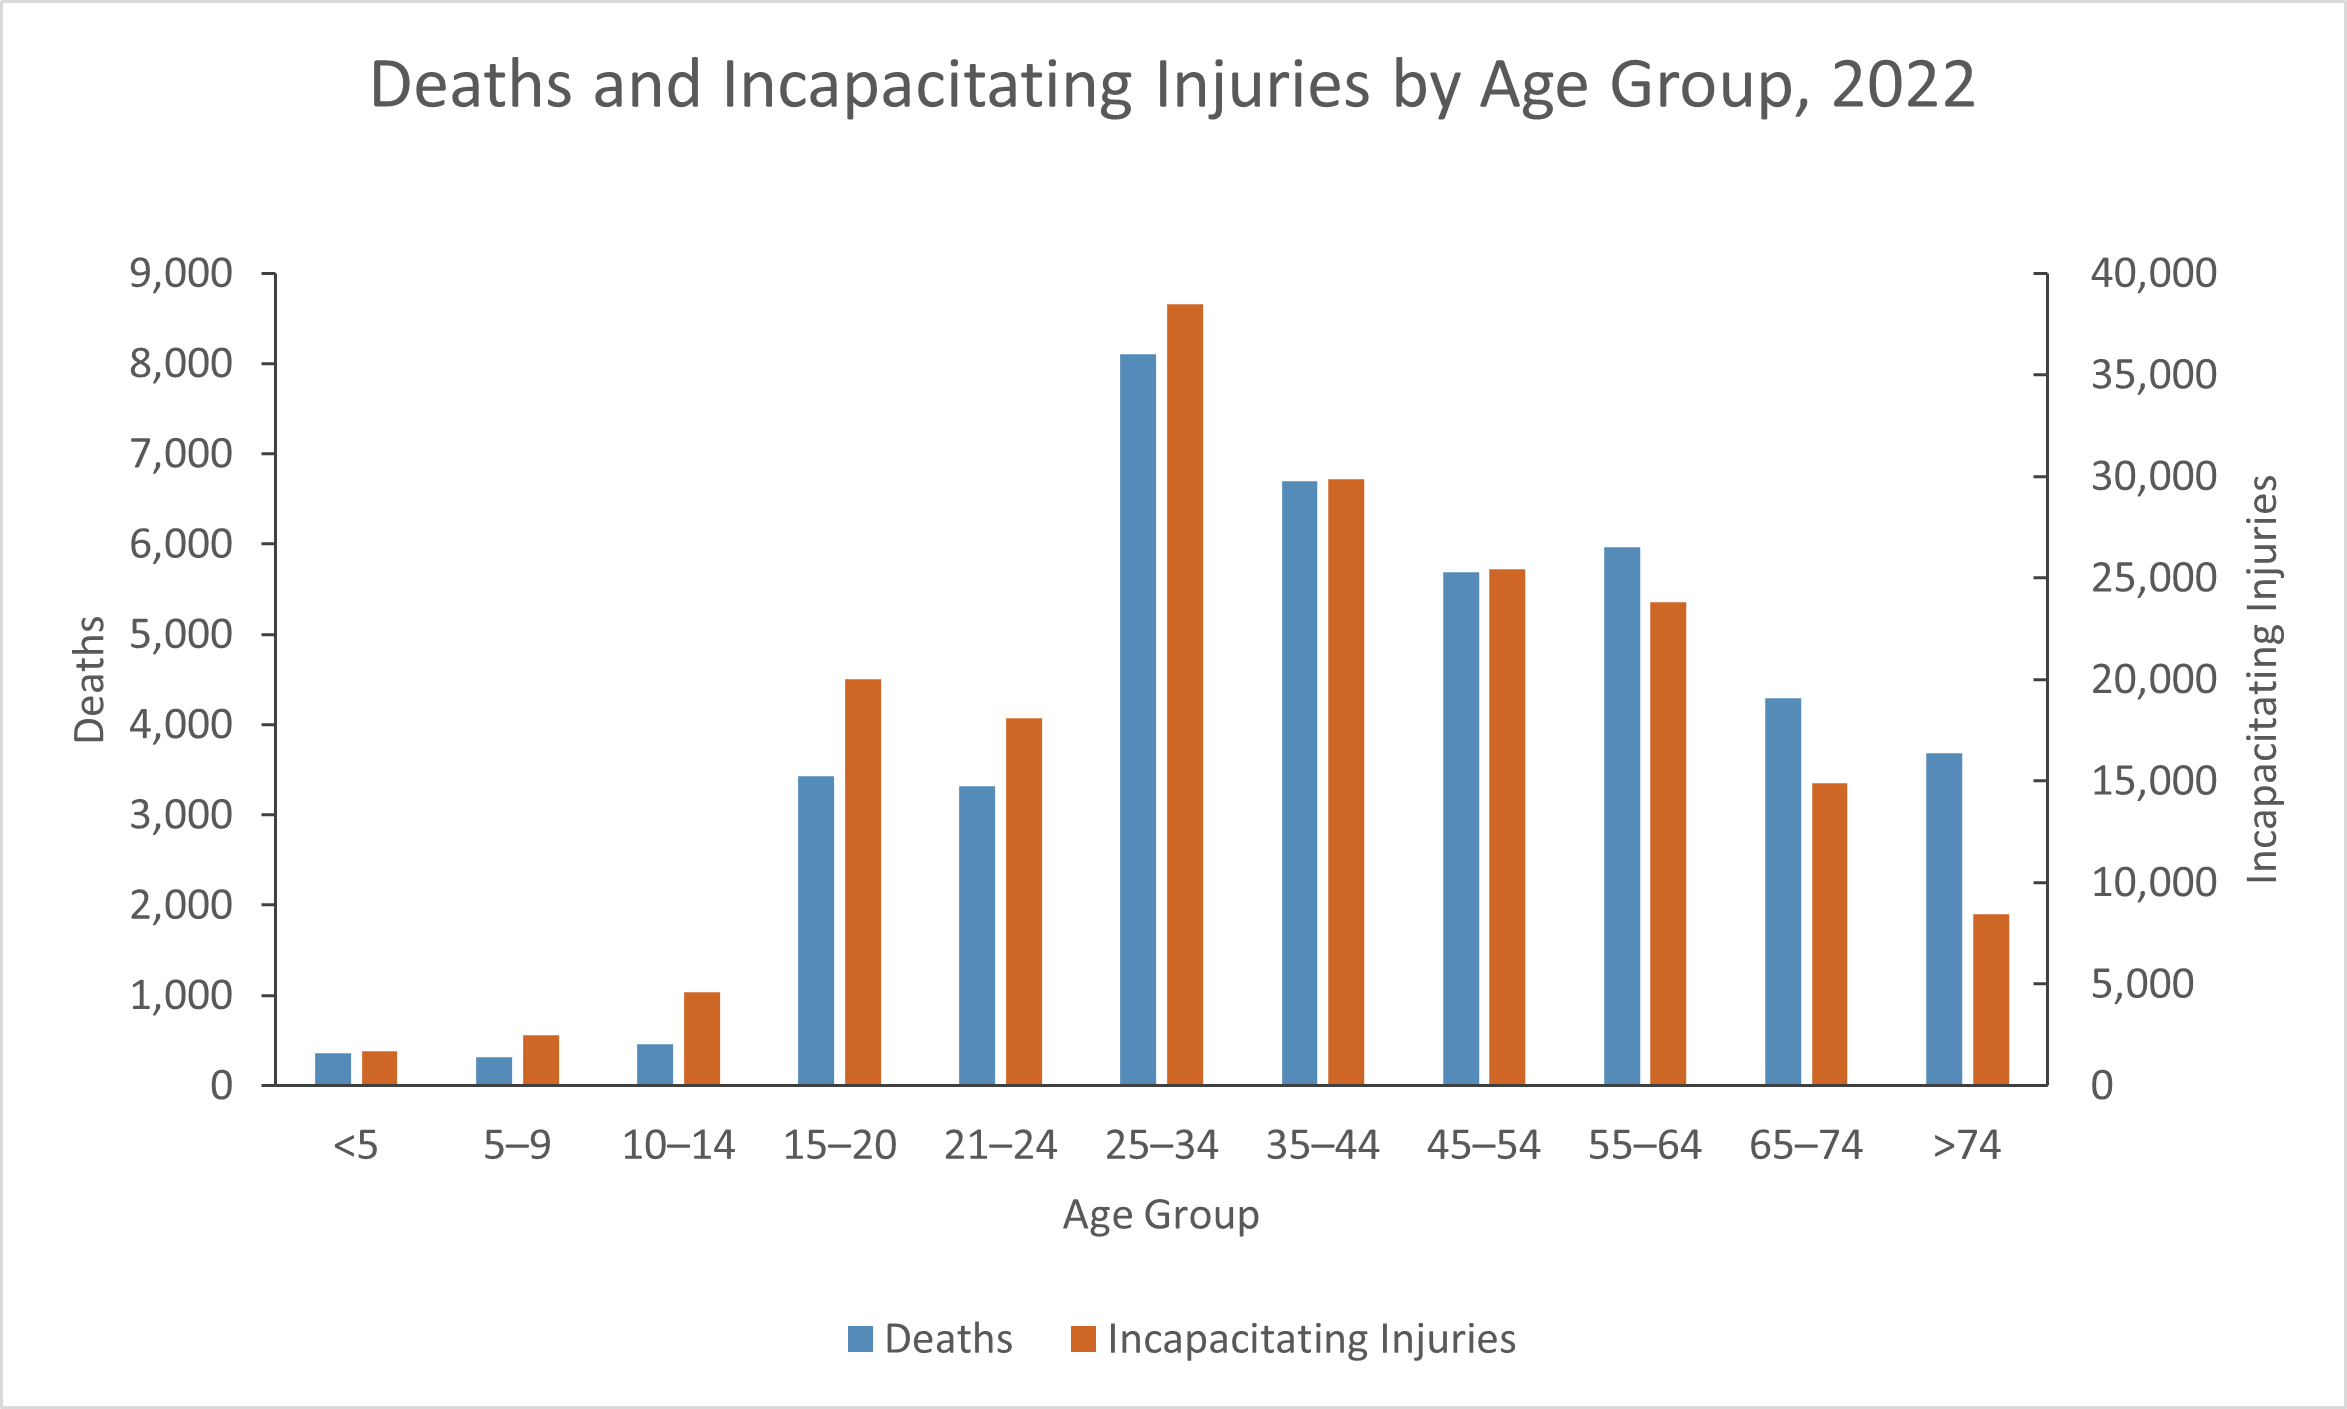
- In 2022, drivers ages 15–20 made up 5.0% of licensed drivers in the United States but 8.1% of drivers in fatal crashes. (NHTSA, July 2024)
- For drivers ages 15–20 in 2022, 58.73 males per 100,000 licensed drivers were involved in fatal traffic crashes, compared with 22.74 females per 100,000 licensed drivers. (NHTSA, July 2024)
- Young drivers are more involved in fatal crashes per mile driven than are older drivers (except those ages 80 or older). Drivers ages 16–19 were involved in 4.8 fatal crashes per 100 million travel miles, compared with 3.3 for drivers ages 20–24, 2.3 for drivers ages 25–29, 1.4 for drivers ages 30–59, 1.3 for drivers ages 60–69, 1.8 for drivers ages 70–79, and 5.4 for drivers ages 80+. (NHTSA, 2023)
- In 2022, 6.8% of traffic crash fatalities were teenagers. This figure included 8.6% of passenger vehicle occupant fatalities, 3.4% of pedestrian fatalities, 3.7% of motorcyclist fatalities, 6.0% of bicyclist fatalities, and 13.3% of all-terrain vehicle (ATV) fatalities. (IIHS, June 2024)
- In 2022, 50.7% of teenage crash deaths occurred on Friday (13.1%), Saturday (18.3%), or Sunday (19.2%). (IIHS, June 2024)
- In 2022., teenage crash deaths occurred most frequently from 9 p.m. to midnight (19.9%) and 6 p.m. to 9 p.m. (15.8%). (IIHS, June 2024)
- The crash fatality rate per mile driven for drivers ages 16–19 is nearly triple that of drivers ages 20 and older. The crash fatality rate is highest at ages 16–17. (IIHS, June 2024)
- In 2022, 5,339 people were killed in crashes involving at least one driver aged 15–20. 2,034 (38.1%) of these fatalities were the young drivers themselves. (NHTSA, July 2024)
- In 2022, 62% of deaths among passenger vehicle occupants ages 16–19 were the drivers. (IIHS, June 2024)
- In 2022, 56% of the deaths of teenage passengers occurred in vehicles driven by teenage drivers. 13% of the deaths of passengers of all ages occurred in vehicles driven by teenage drivers. (IIHS, June 2024)
- The proportion of drivers aged 65 and older increased from 14% in 2001 to 22% in 2023. (FHWA, January 2025)
- From 1997 to 2022, the number of licensed drivers ages 70 and older increased by 92%. In 1997, 73% of persons ages 70 and older held driver’s licenses; by 2022, this figure had risen to 97%. (IIHS, July 2024)
- The proportion of fatal crashes involving older drivers has increased from 11% in 2001 to 20% in 2022. However, the older population has grown at a rate faster than the increase in fatalities involving older drivers, from 35.3 million in 2001 to 57.8 million in 2022. The number of licensed drivers ages 65 and older soared from 27.6 million in 2001 to 51.5 million in 2022. (NHTSA, August 2024; Fatality Analysis Reporting System, NHTSA, accessed May 2025)
- For drivers aged 65 and older, the rate of fatalities per 100,000 population increased from 12.81 in 2013 to 13.79 in 2022. (IIHS, July 2024)
- In the late 1970s, the proportion of fatally injured motorcyclists ages 50 and older started to increase, rising from 3% of all rider deaths in 1975 to 14% in 1997 and 34% in 2022. In contrast, just 27% of the fatally injured motorcyclists in 2022 were younger than 30, compared with 80% in 1975. (IIHS, December 2024)
- The average age of pedestrians killed in traffic crashes increased slightly from 46 in 2013 to 48 in 2022. (NHTSA, July 2024)
- Of the 1,129 children ages 14 and younger killed in traffic crashes in 2022, 188 (17%) were pedestrians. Of the 2,968 persons ages 60–64 killed in traffic crashes, 694 (23%) were pedestrians, the highest percentage of all age groups. (NHTSA, December 2024)
Effects of the COVID-19 Pandemic
- As we have seen, in 2020–2021, there were upticks in vehicle fatality rates and motorcyclist fatality rates, which partially reversed prior longer-term downtrends. There is evidence that the effects of the COVID-19 pandemic may have been responsible.
- First, the upticks were statistically significant. The AAA Foundation for Traffic Safety had developed predictive models for forecasting monthly traffic fatalities in 2020, based on data obtained from monthly traffic fatalities in 2011–2019. However, the actual traffic fatalities in 2020 significantly exceeded the forecasts, falling outside the 95% confidence interval (CI) for forecasted fatalities. In particular, the actual traffic fatalities of persons aged 19–24 exceeded the forecast by 19.0%, and the actual traffic fatalities of persons aged 25–39 exceeded the forecast by 22.8%. Actual traffic fatalities for persons aged 70 and older were 11.9% lower than originally forecast. See the following charts from that same source. (AAA Foundation for Traffic Safety, December 2022)
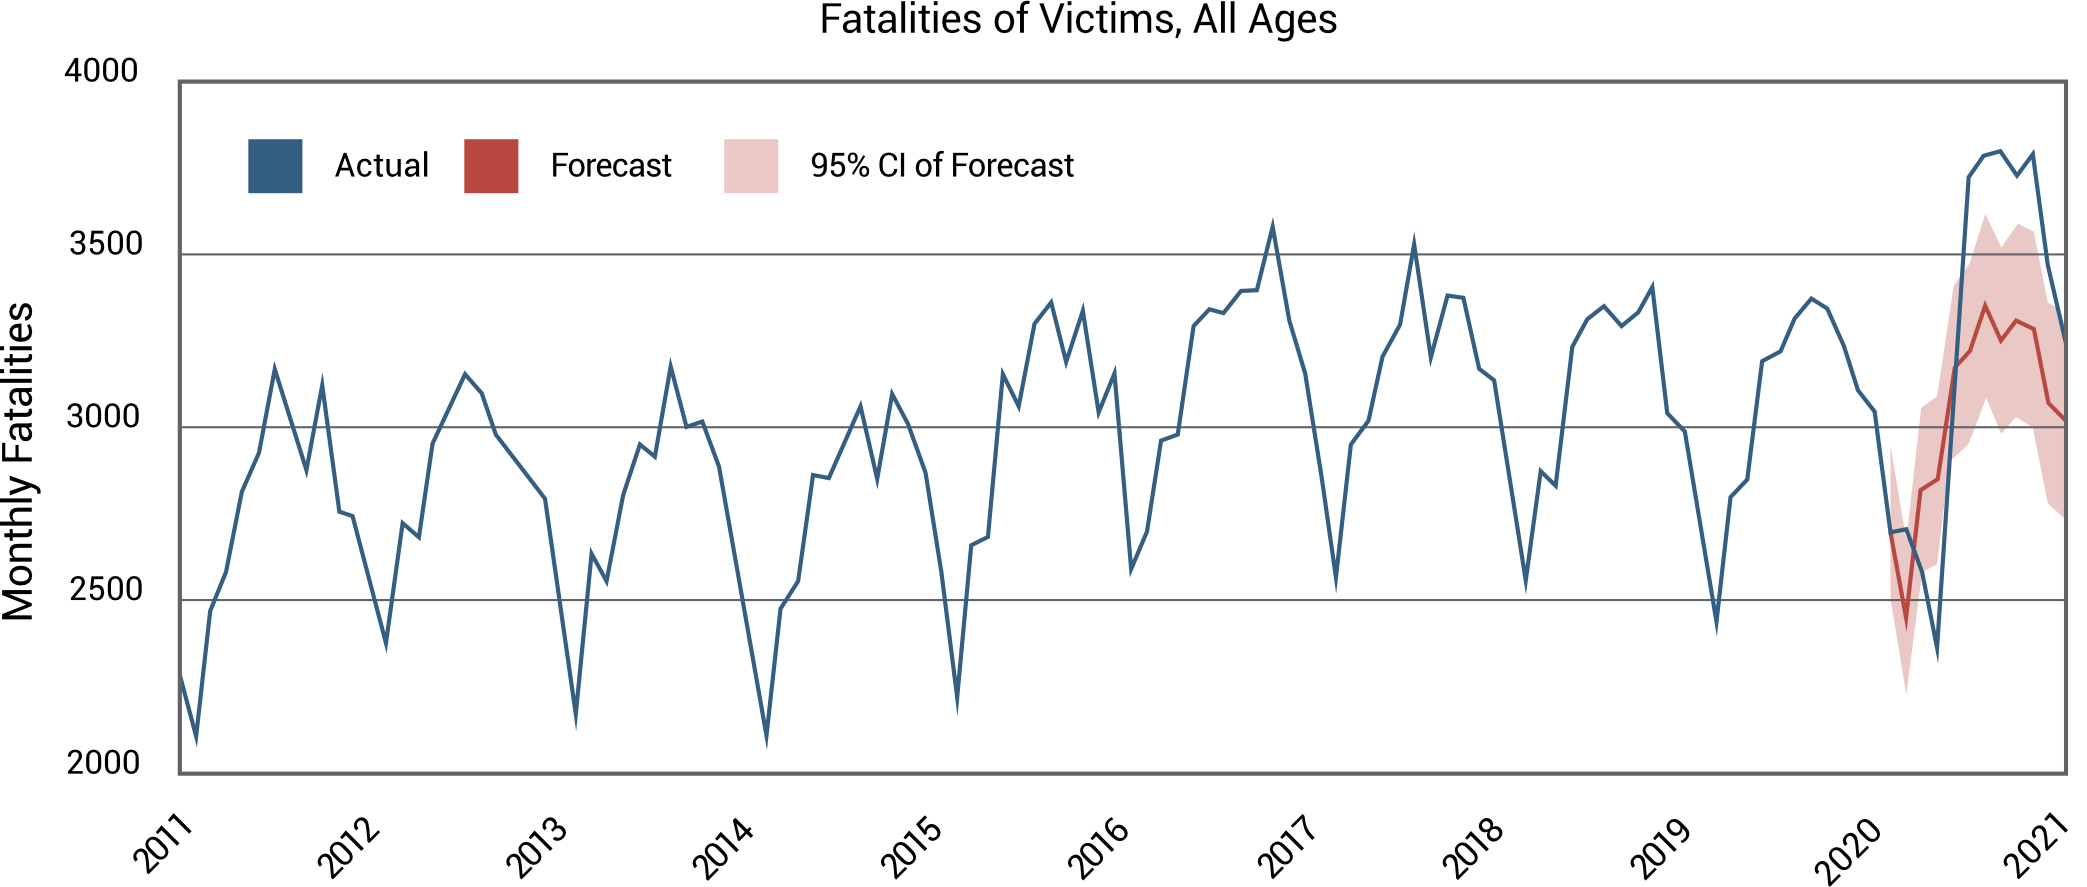
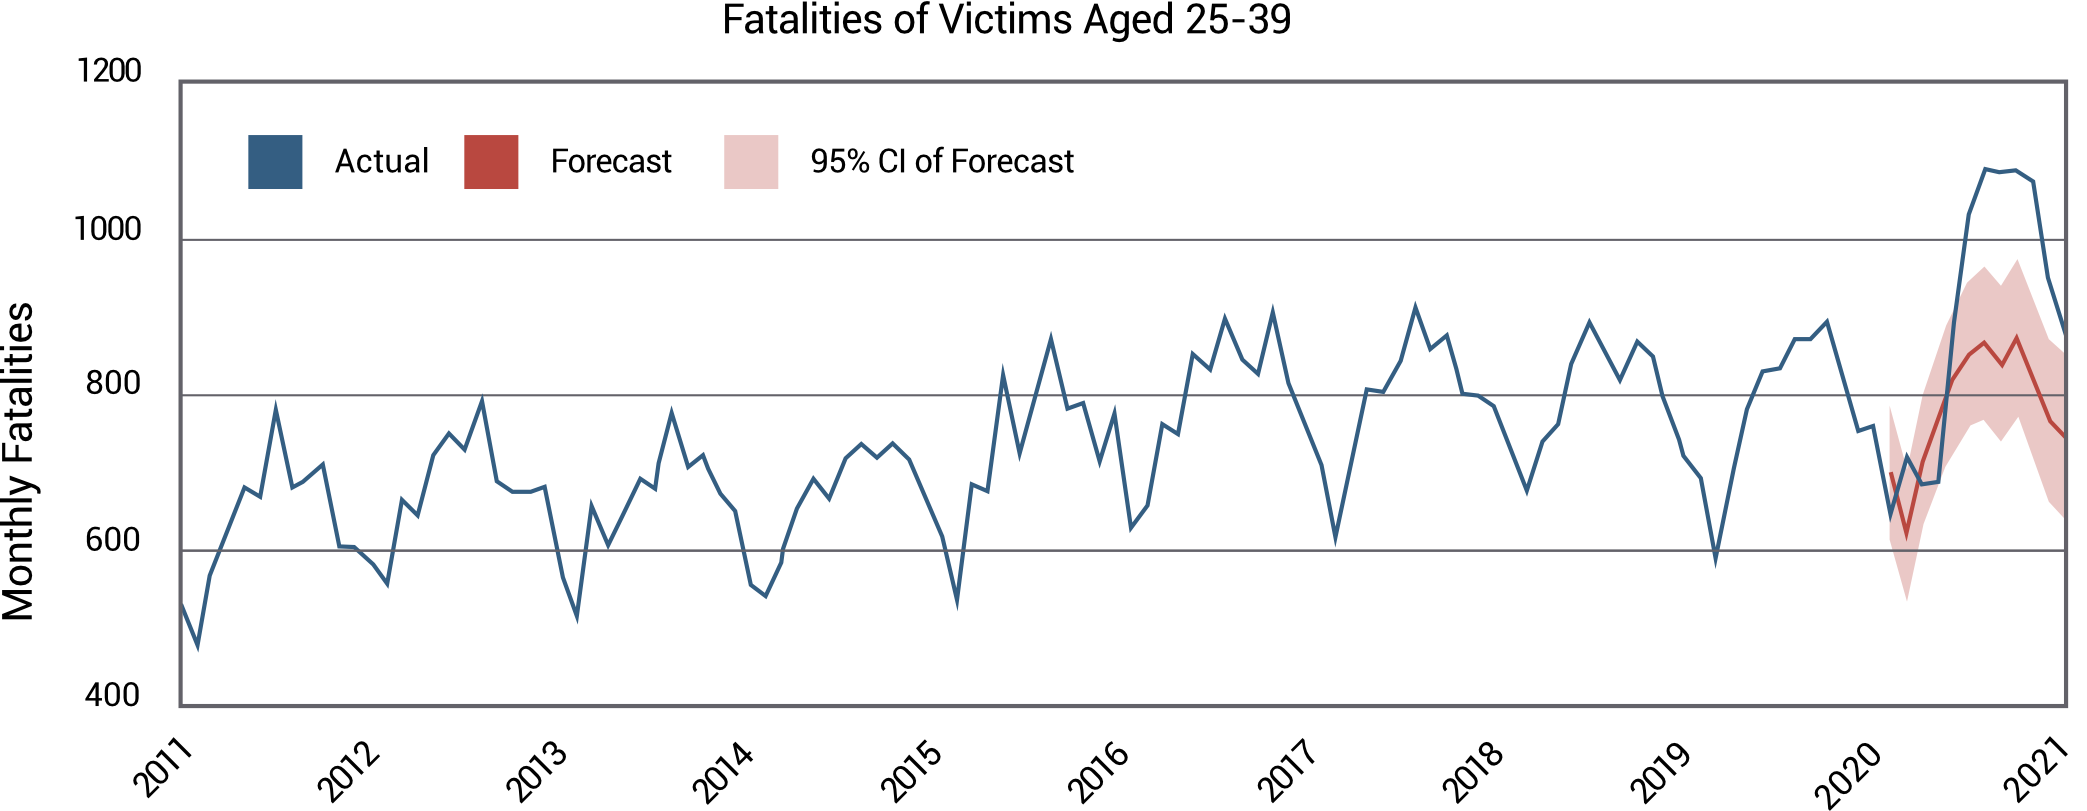
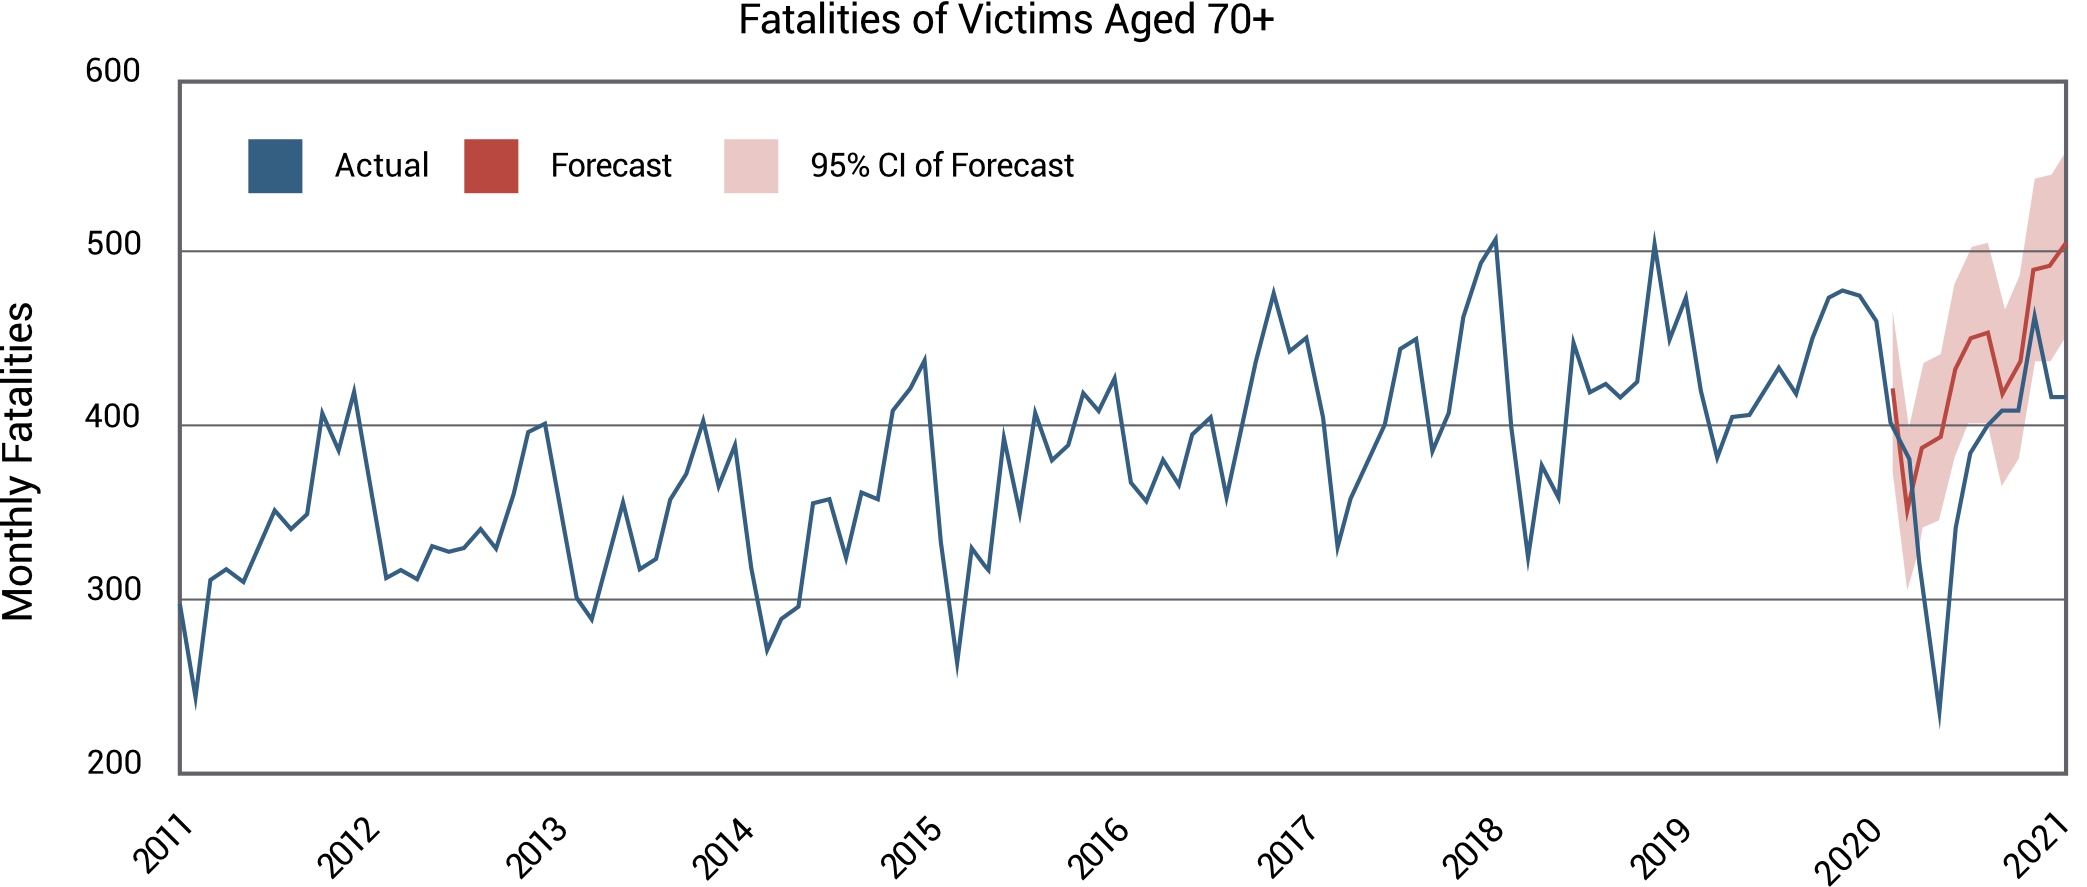
- Second, a survey of drivers conducted in 2020 by the AAA Foundation for Traffic Safety suggested that the demographics of drivers still on the road during the COVID-19 pandemic in 2020 had shifted from prior years. 60% of drivers reported that they had reduced their driving in response to the COVID pandemic. The drivers who had reduced their driving had a median age of 50, and 56% were female. 36% of drivers had not changed their amount of driving. This group also had a median age of 50, but 56% were male. 4% of drivers said they had increased their driving. This group was younger (median age of 39) and strongly male (64%). It has long been known that young male drivers tend to be higher-risk drivers than other drivers. (AAA Foundation for Traffic Safety, February 2022)
- Third, the 4% of surveyed drivers who had increased their driving in 2020 were also more likely to have reported engaging in risky driving behaviors within the past 30 days. For example, 40% of this group said they had sent text messages, compared with only 20% of those who had reduced their driving. 45% of this group reported they had run red lights, compared with just 25% of those who had reduced their driving. 21% of this group said they had driven without wearing seat belts, compared with just 9% of those who had reduced their driving. Therefore, if the sample of drivers surveyed was representative of the general driver population, higher-risk drivers had spent more time on the road in 2020 than before, and lower-risk drivers had spent less time on the road than before. See the following chart. (AAA Foundation for Traffic Safety, February 2022)
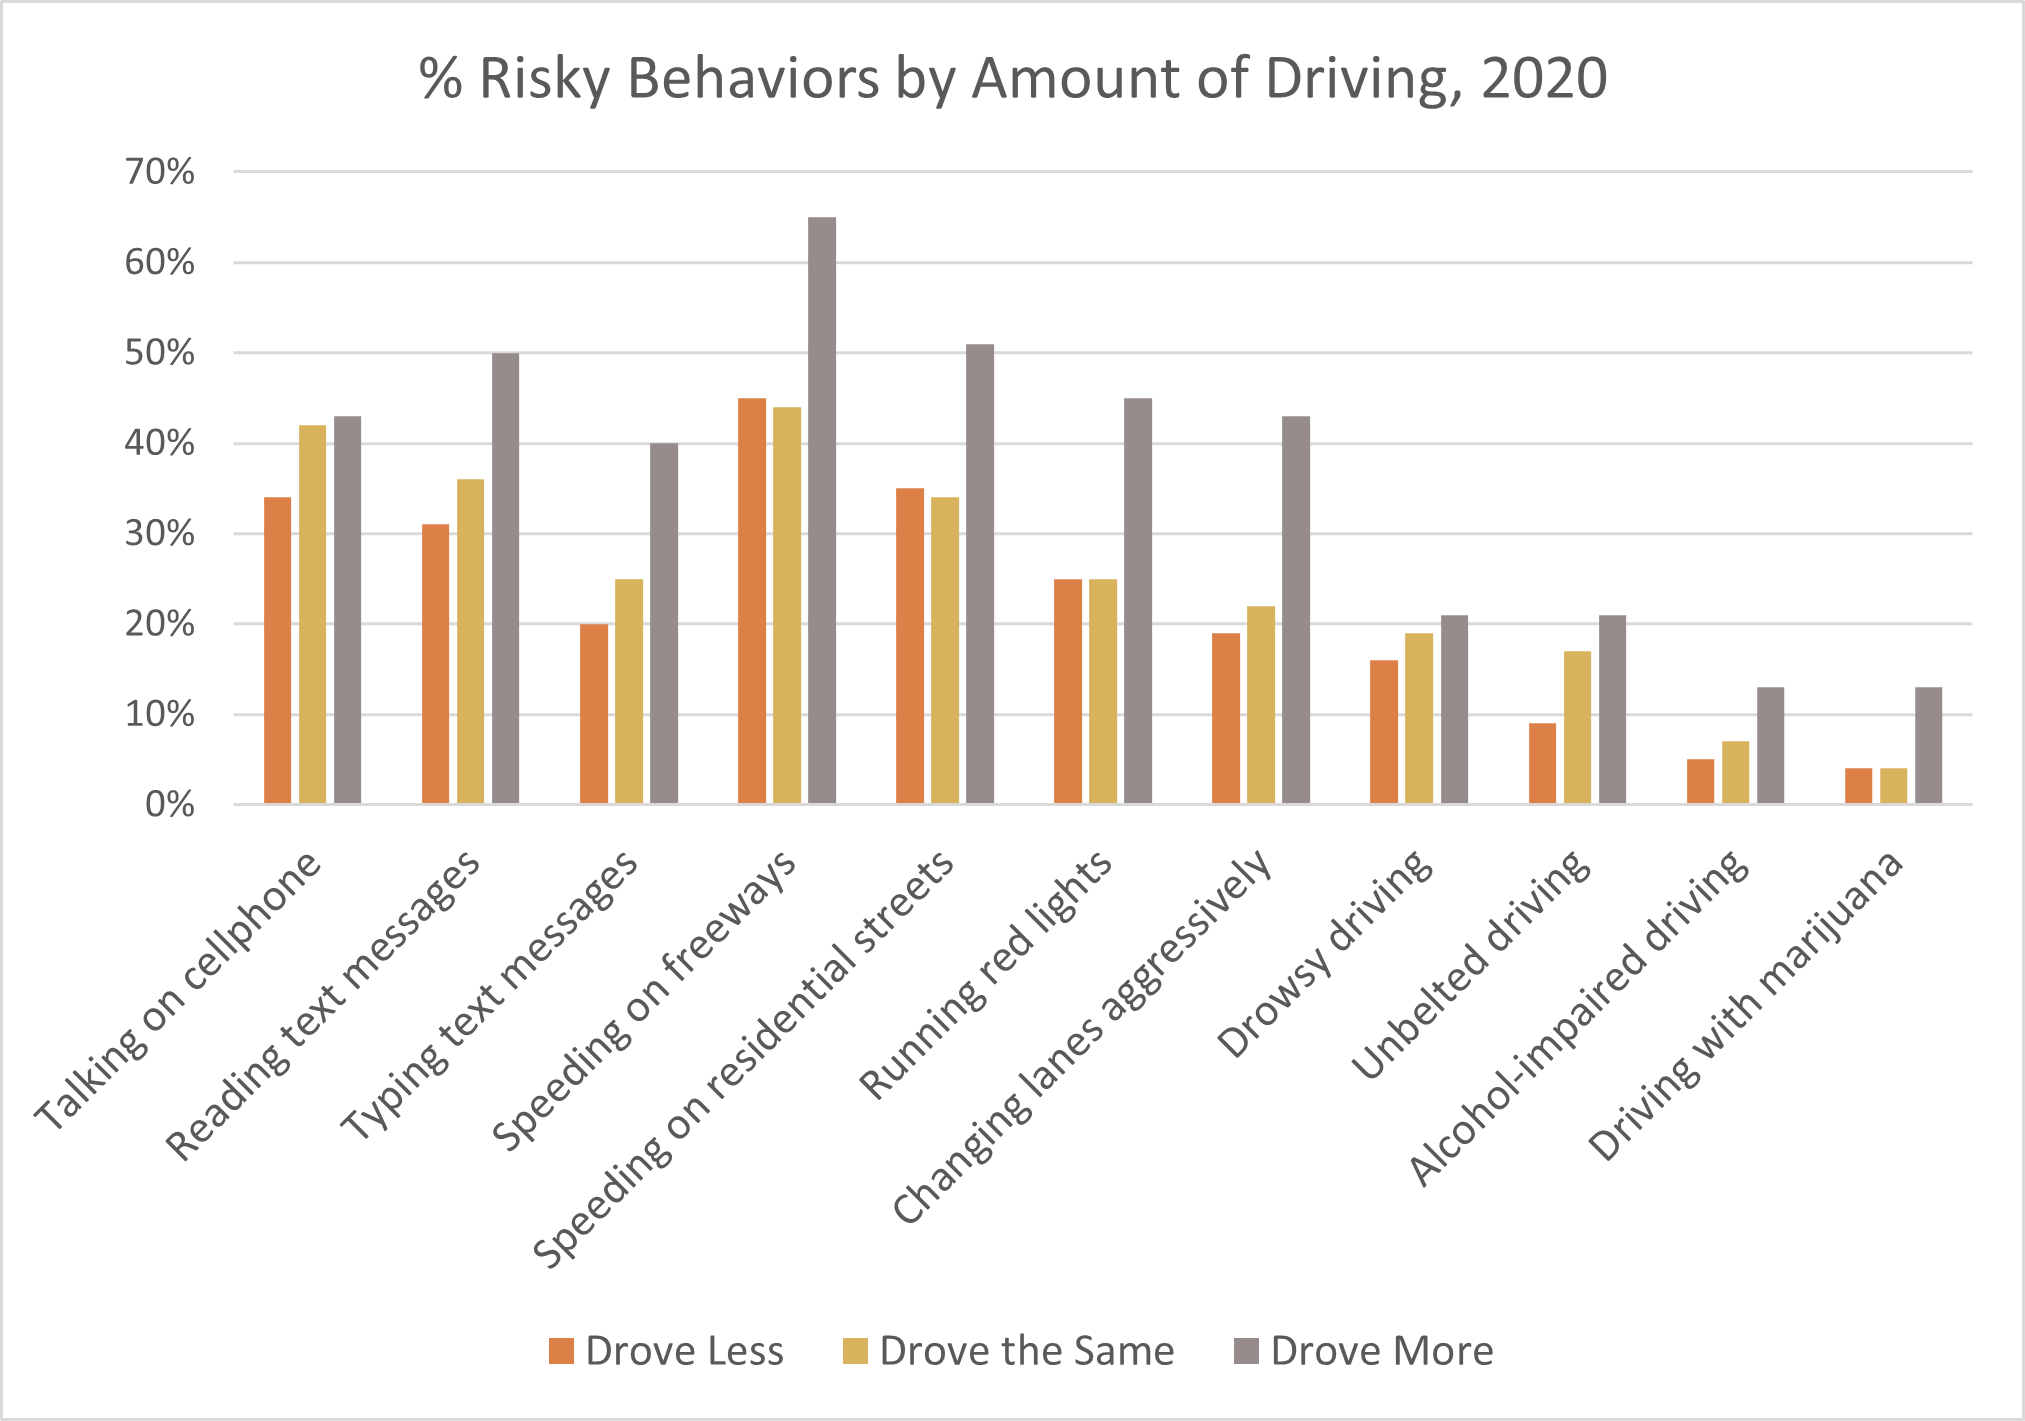
- Another theory about the effects of the COVID pandemic focused on vehicle speeds and traffic congestion. Traffic congestion effectively limits the maximum speeds at which vehicles can travel. A statistical analysis of traffic and vehicle speeds in California from March 2020 through May 2020 found that with fewer traffic jams as many drivers stayed home, average highway speeds increased by 2 to 3 mph throughout California. However, speeds increased by as much as 10 to 15 mph in some counties where traffic congestion had been common before the pandemic, such as San Francisco and Santa Clara. Higher speeds made crashes more deadly. Researchers found that just a 1% increase in average vehicle speeds translated into a 4% increase in traffic fatalities. The proportion of crashes considered severe (those more likely to involve fatalities) increased by 4.8 percentage points. (University of Colorado, April 2023)
Fatalities by gender
- Worldwide, males are typically three times more likely than females to be killed in road crashes. (World Health Organization, December 2023)
- In the United States in 2021, 66% of passenger car occupants who died in crashes were male. 72% of passenger car drivers who died in crashes were male. (IIHS, 2023)
- Of total motor vehicle crash deaths in 2022, 30,669 (72.3%) were male and 11,737 (27.7%) were female. Males comprised 71.9% of passenger vehicle drivers killed, 96.6% of large truck drivers killed, 73.8% of large truck passengers killed, 70.6% of pedestrians killed, 86.8% of bicyclists killed, and 92.3% of motorcyclists killed. However, males made up only 48.7% of passenger vehicle passengers killed. (IIHS, June 2024)
- In 2022, just 4% of motorcycle operators who were killed in crashes were female, but 91% of motorcycle passengers who died were female. (IIHS, June 2024)
- Since 1975, teenage crash deaths have decreased more among males than among females. In 1975, 74.7% of persons aged 13–19 who were killed in motor vehicle accidents were male. In 2019, 68.7% were male. (IIHS, June 2024)
- In a nationwide survey of 2,739 active licensed drivers ages 16 and older in 2023, significant percentages of these drivers admitted to engaging in various risky driving behaviors at least once during the previous 30 days. See the following table. It also lists the percentages of drivers who admitted to engaging in these behaviors “regularly” or “fairly often” during the previous 30 days. The most common risky behavior was speeding on a freeway; 49.2% – nearly half – of these drivers admitted to doing it at least once. (AAA Foundation for Traffic Safety, December 2024)
|
Driving Behavior |
Regularly/Fairly Often (Percent) |
At Least Once (Percent) |
|
Drove 15 mph over the speed limit on a freeway |
13.2 |
49.2 |
|
Drove while reading a text or email on a cell phone |
4.3 |
37.0 |
|
Drove 10 mph over the speed limit on a residential street |
6.8 |
36.3 |
|
Drove while holding and talking on a cell phone |
5.1 |
35.5 |
|
Drove through a light that had just turned red |
0.9 |
26.9 |
|
Drove while manually typing or sending a text/email |
3.2 |
26.6 |
|
Drove aggressively by switching lanes quickly or tailgating |
1.8 |
21.8 |
|
Drove when so tired you had a hard time keeping your eyes open |
0.8 |
19.5 |
|
Drove without wearing a seatbelt |
3.8 |
12.4 |
|
Drove when you thought you might be over the alcohol limit |
0.2 |
7.4 |
|
Rode with a driver who had too much alcohol |
0.1 |
6.4 |
|
Drove shortly after using marijuana |
1.5 |
5.0 |
|
Drove when using impairing prescription drugs |
0.6 |
2.8 |
Distracted Driving Statistics
- In a national observational survey conducted in 2022, 2.1% of drivers stopped at intersections were observed holding hand-held cell phones to their ears (down from 4.6% in 2013). 3.1% of drivers were observed manipulating hand-held devices (down from 1.7% in 2013). 6.5% of drivers ages 16–24 were manipulating hand-held devices (up from 2.9% in 2013). (NHTSA, January 2024)
- It is estimated that at any moment during daylight hours, an average of over 324,000 drivers are holding a hand-held cell phone to their ear while they’re driving. (Governors Highway Safety Association, April 2025)
- The following chart lists the most common types of driver distractions in traffic crashes, based on naturalistic driving studies and other data. For each type of distraction, its relative crash risk (as an odds ratio) and its prevalence (the percentage of crashes in which it had occurred) are shown. Dialing a cell phone carries a high crash risk; you are 12.2 times as likely to have a crash while dialing. However, dialing occurred in only 0.1% of crashes (relatively low prevalence), probably because the act of dialing lasts only a moment. On the other hand, conversing with passengers is extremely common and occurred in 3.2% of crashes (relatively high prevalence), but such a conversation increased the driver’s crash risk by only 40% (relatively low crash risk). (NHTSA and Virginia Tech Transportation Institute, accessed April 2025)
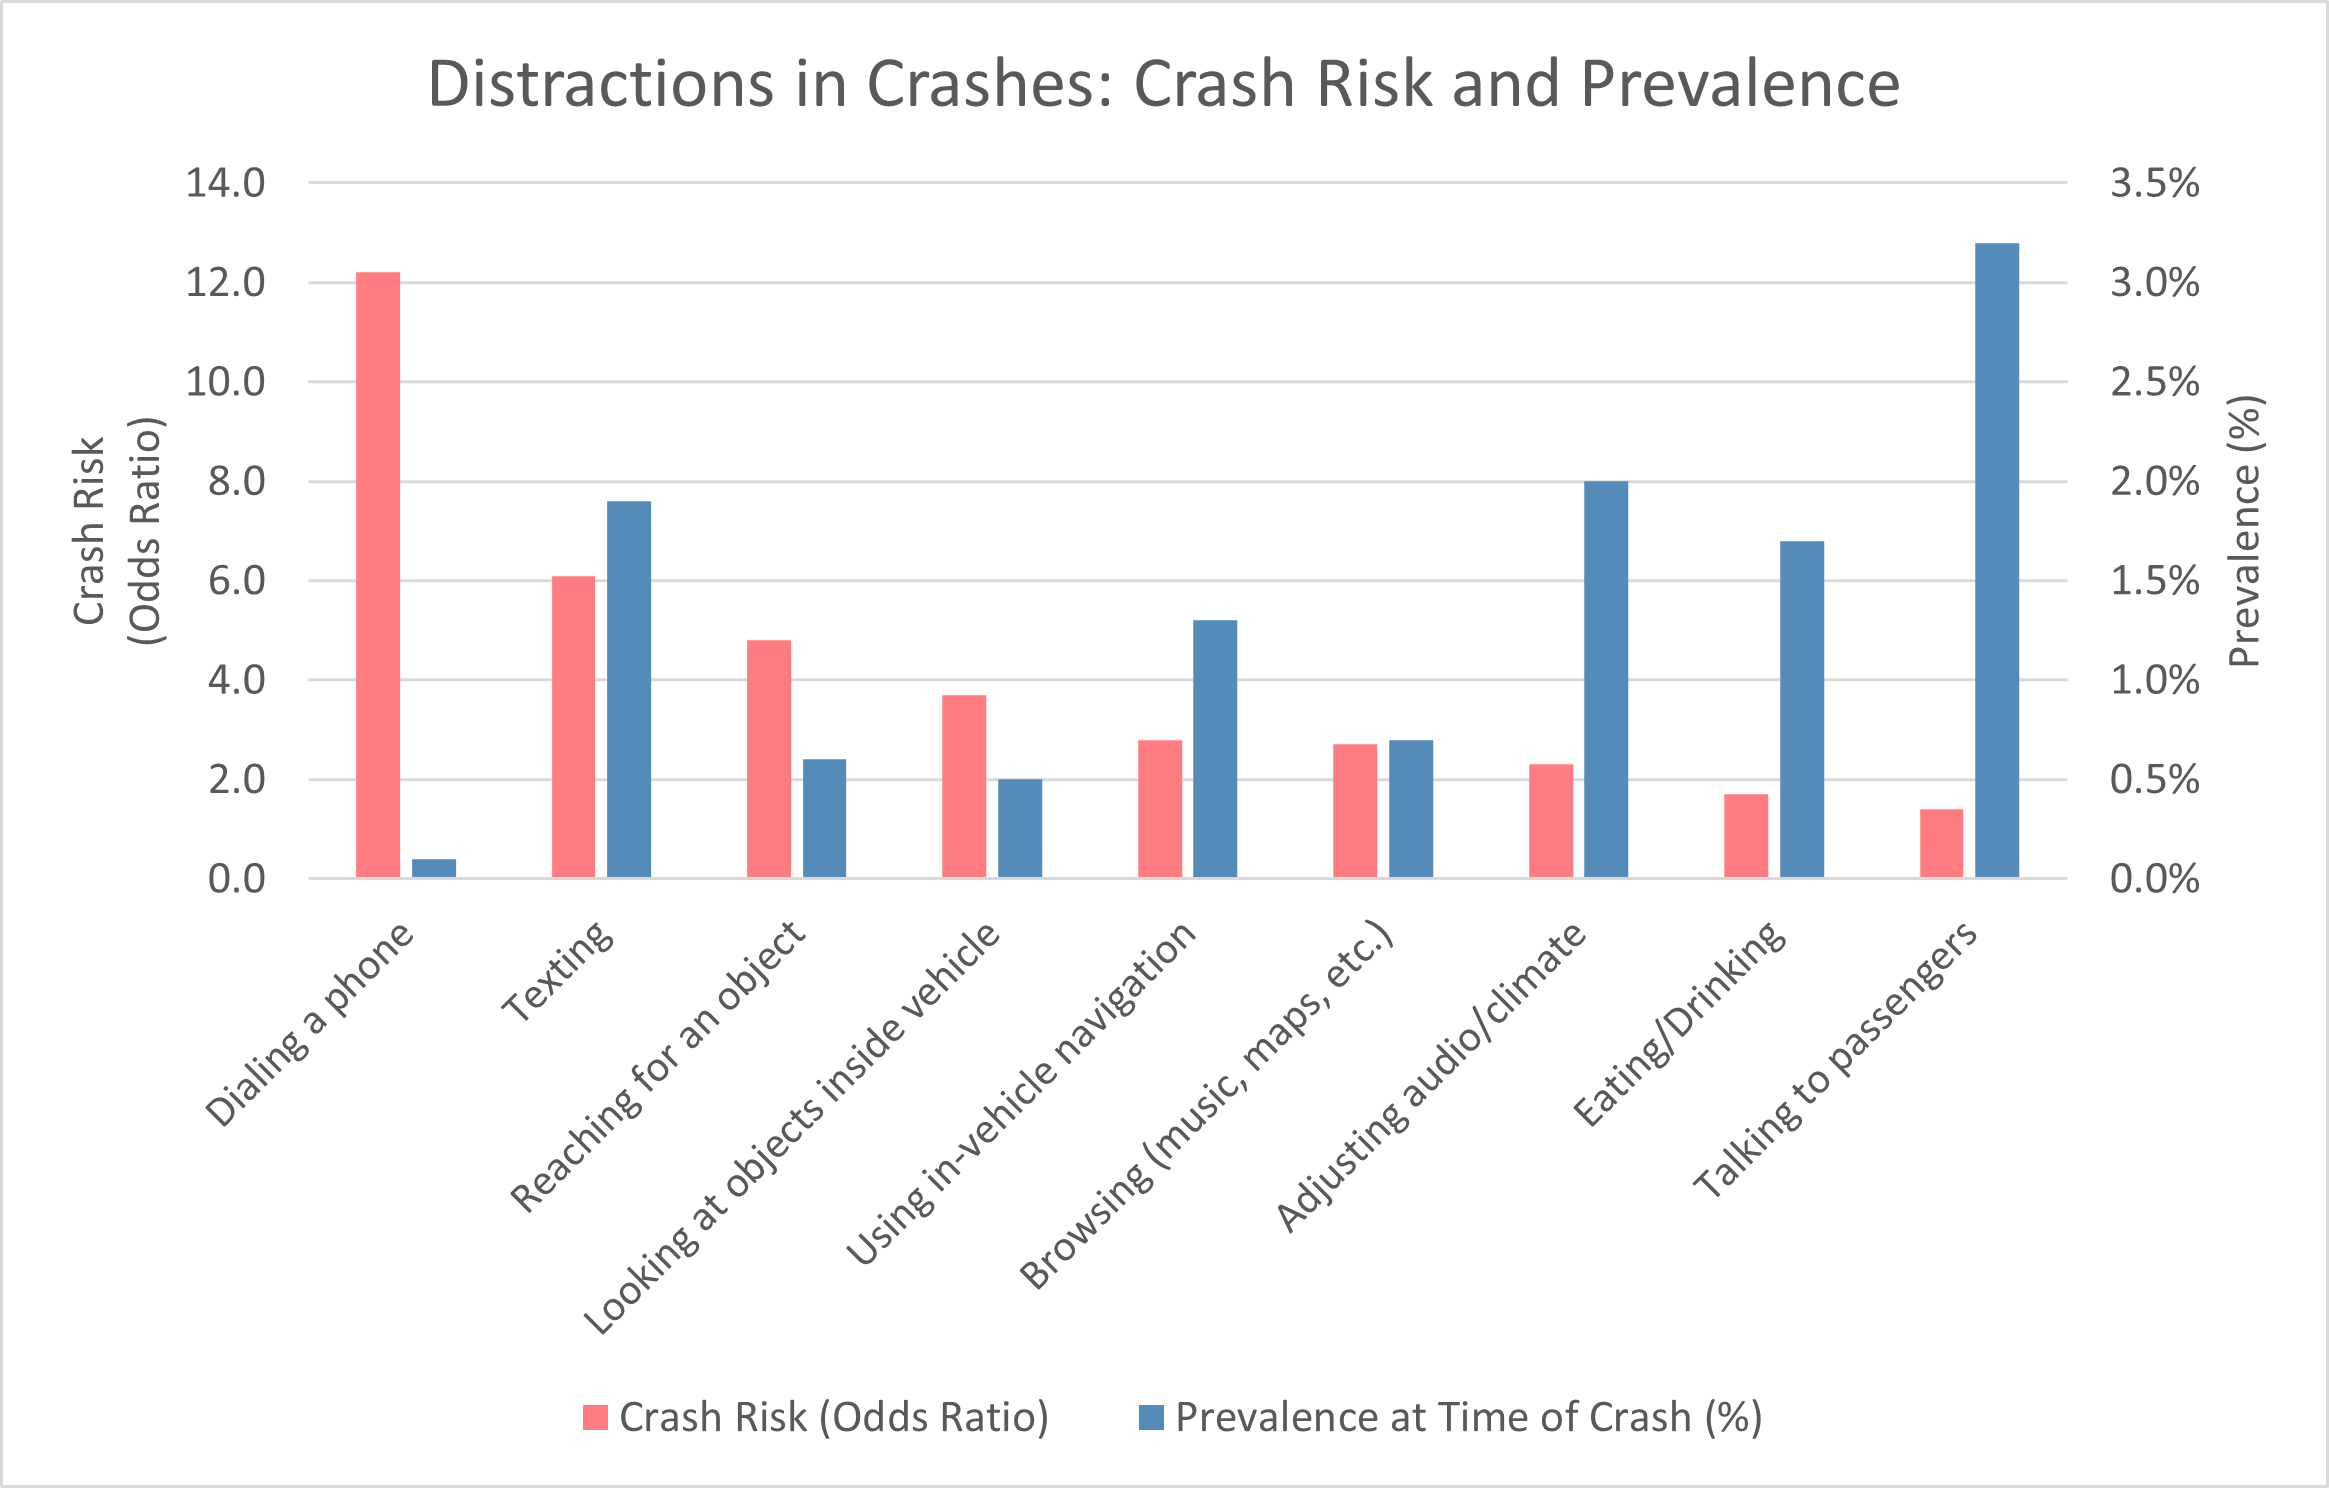
- In 2022, 3,126 drivers involved in fatal crashes were categorized as distracted. The following table lists the numbers of these drivers engaged in various types of distractions: 62.7% of the distracted drivers had been “lost in thought” or daydreaming, 12.0% of the distracted drivers had been using cellphones, and 8.9% of the distracted drivers had been looking at something outside the vehicle (e.g., rubbernecking). The numbers of drivers in this table sum to 3,141 (100.5%) because about 15 drivers had been engaged in more than one type of distraction when the crash occurred. Note that these figures are likely underestimates because of the difficulty of determining what distractions, if any, were affecting a driver when a crash occurred. (IIHS, June 2024)
|
Distraction type |
Number of drivers |
Percent |
|
"Lost in thought" (daydreaming) |
1,959 |
62.7% |
|
Cellphone use (talking, listening, dialing, texting) |
375 |
12.0% |
|
Outside person, object or event, such as rubbernecking |
277 |
8.9% |
|
Using/adjusting other device/controls integral to vehicle, such as rear-view mirrors, seats, or OEM navigation system |
127 |
4.1% |
|
Other occupants in the vehicle |
122 |
3.9% |
|
Using or reaching for device brought into the vehicle, such as navigational device or headphones |
101 |
3.2% |
|
Other distraction, not specified |
81 |
2.6% |
|
Eating or drinking |
44 |
1.4% |
|
Adjusting audio or climate controls |
30 |
1.0% |
|
Moving object in vehicle, such as pet or insect |
14 |
0.4% |
|
Smoking related (includes smoking, lighting up, putting ashes in ashtray) |
11 |
0.4% |
|
All distracted drivers |
3,126 |
100.5% |
- Based on naturalistic driving data, drivers of vehicles equipped with Level 2 driving automation systems were nearly twice as likely to drive distracted when the systems were active when the drivers had prior experience with such systems. This did not happen with drivers who had no prior experience with such systems. (Virginia Tech Transportation Institute, accessed April 2025)
- A study based on naturalistic driving data looked at the prevalence of “multitasking additional-to-driving (MAD)” (situations where two or more distractions took place at the same time), compared with “single task additional-to-driving (SAD) (i.e., situations with just one distraction). The prevalence of SAD or MAD was defined as the percentage of times that distracting situation occurred. Crashes were coded as four levels: L1, the least serious (tire strikes) to L4, the most serious. The prevalence of SAD remained with a narrow range (38% to 44%) for all crash scenarios, but the prevalence of MAD varied significantly, from 11% when no crashes occurred to 39% for rear-end striking (i.e., when the driver’s vehicle rear-ended the vehicle ahead), which was just slightly less than the 40% for SAD. This meant that a whopping 79% of rear-end crashes involved distracted driving, and more than one-third of the rear-end crashes involved multiple distractions. See the following chart. (Virginia Tech Transportation Institute et al., January 2020)
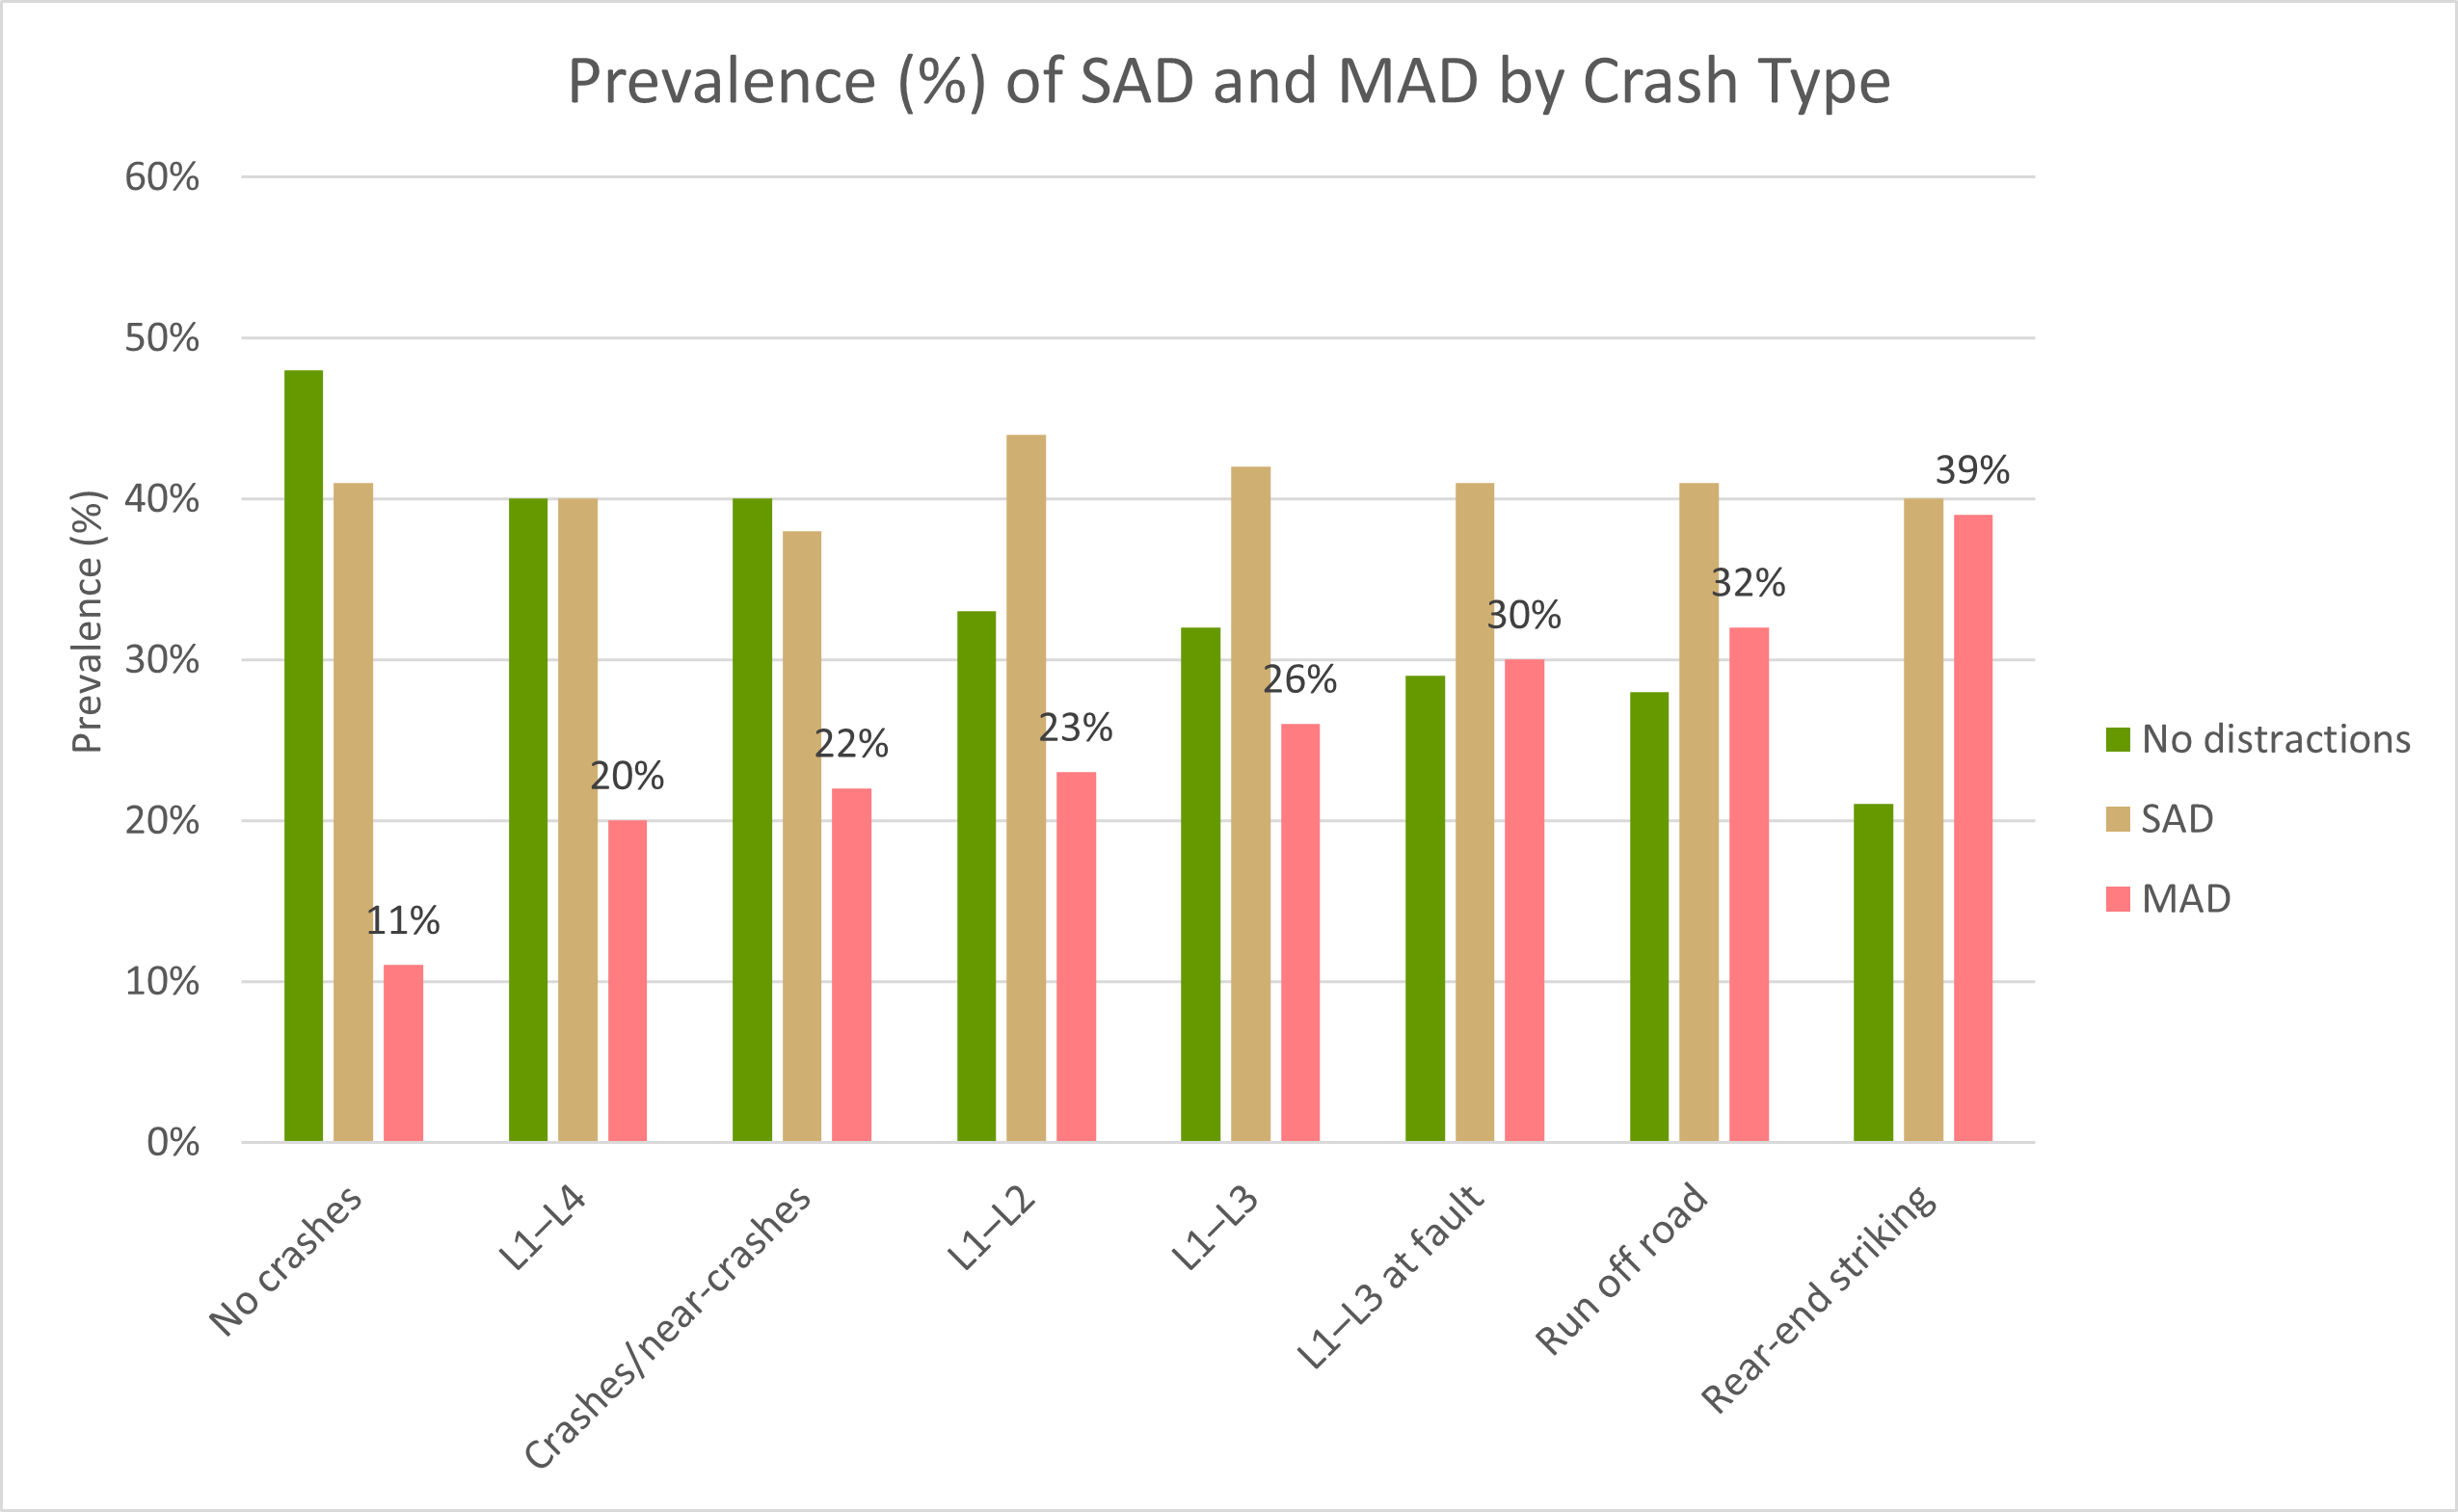
- In 2023, 3,275 people were killed and 324,819 people were injured in crashes involving distracted driving. Crashes involving distracted driving accounted for 8% of all fatal crashes and 13% of injury crashes. (NHTSA, April 2025)
- In 2023, 5% of drivers involved in fatal crashes and 7% of drivers ages 15–20 involved in fatal crashes were reportedly driving distracted at the time. (NHTSA, April 2025)
- In 2023, 369 fatal crashes with 397 fatalities involved cell phone use as a driver distraction. (NHTSA, April 2025)
- In 2023, 7% of drivers ages 15–20 involved in fatal crashes were driving distracted at the time. This is the highest percentage for all age groups of drivers involved in fatal crashes. (NHTSA, April 2025)
- Dialing a phone has been one of the most dangerous distractions, increasing an average driver's chance of crashing by 12 times. Reading or writing increased the risk of crashing by 10 times. Driving while crying or visibly angry also increased the risk of crashing by 10 times. (Virginia Tech Transportation Institute, 2016)
- Child passengers can be 12 times more distracting to a driver than talking on a cell phone. One study found that the average parent driver took their eyes off the road for three minutes and 22 seconds during a 16-minute trip. (Monash University, 2013)
- In a 2024 survey of drivers, 57% of the drivers admitted to adjusting a GPS navigation device while they were driving. Even larger majorities admitted to eating or drinking while driving (59%) and talking on a cell phone (60%) while driving. See the following chart. (The Zebra, April 2024)
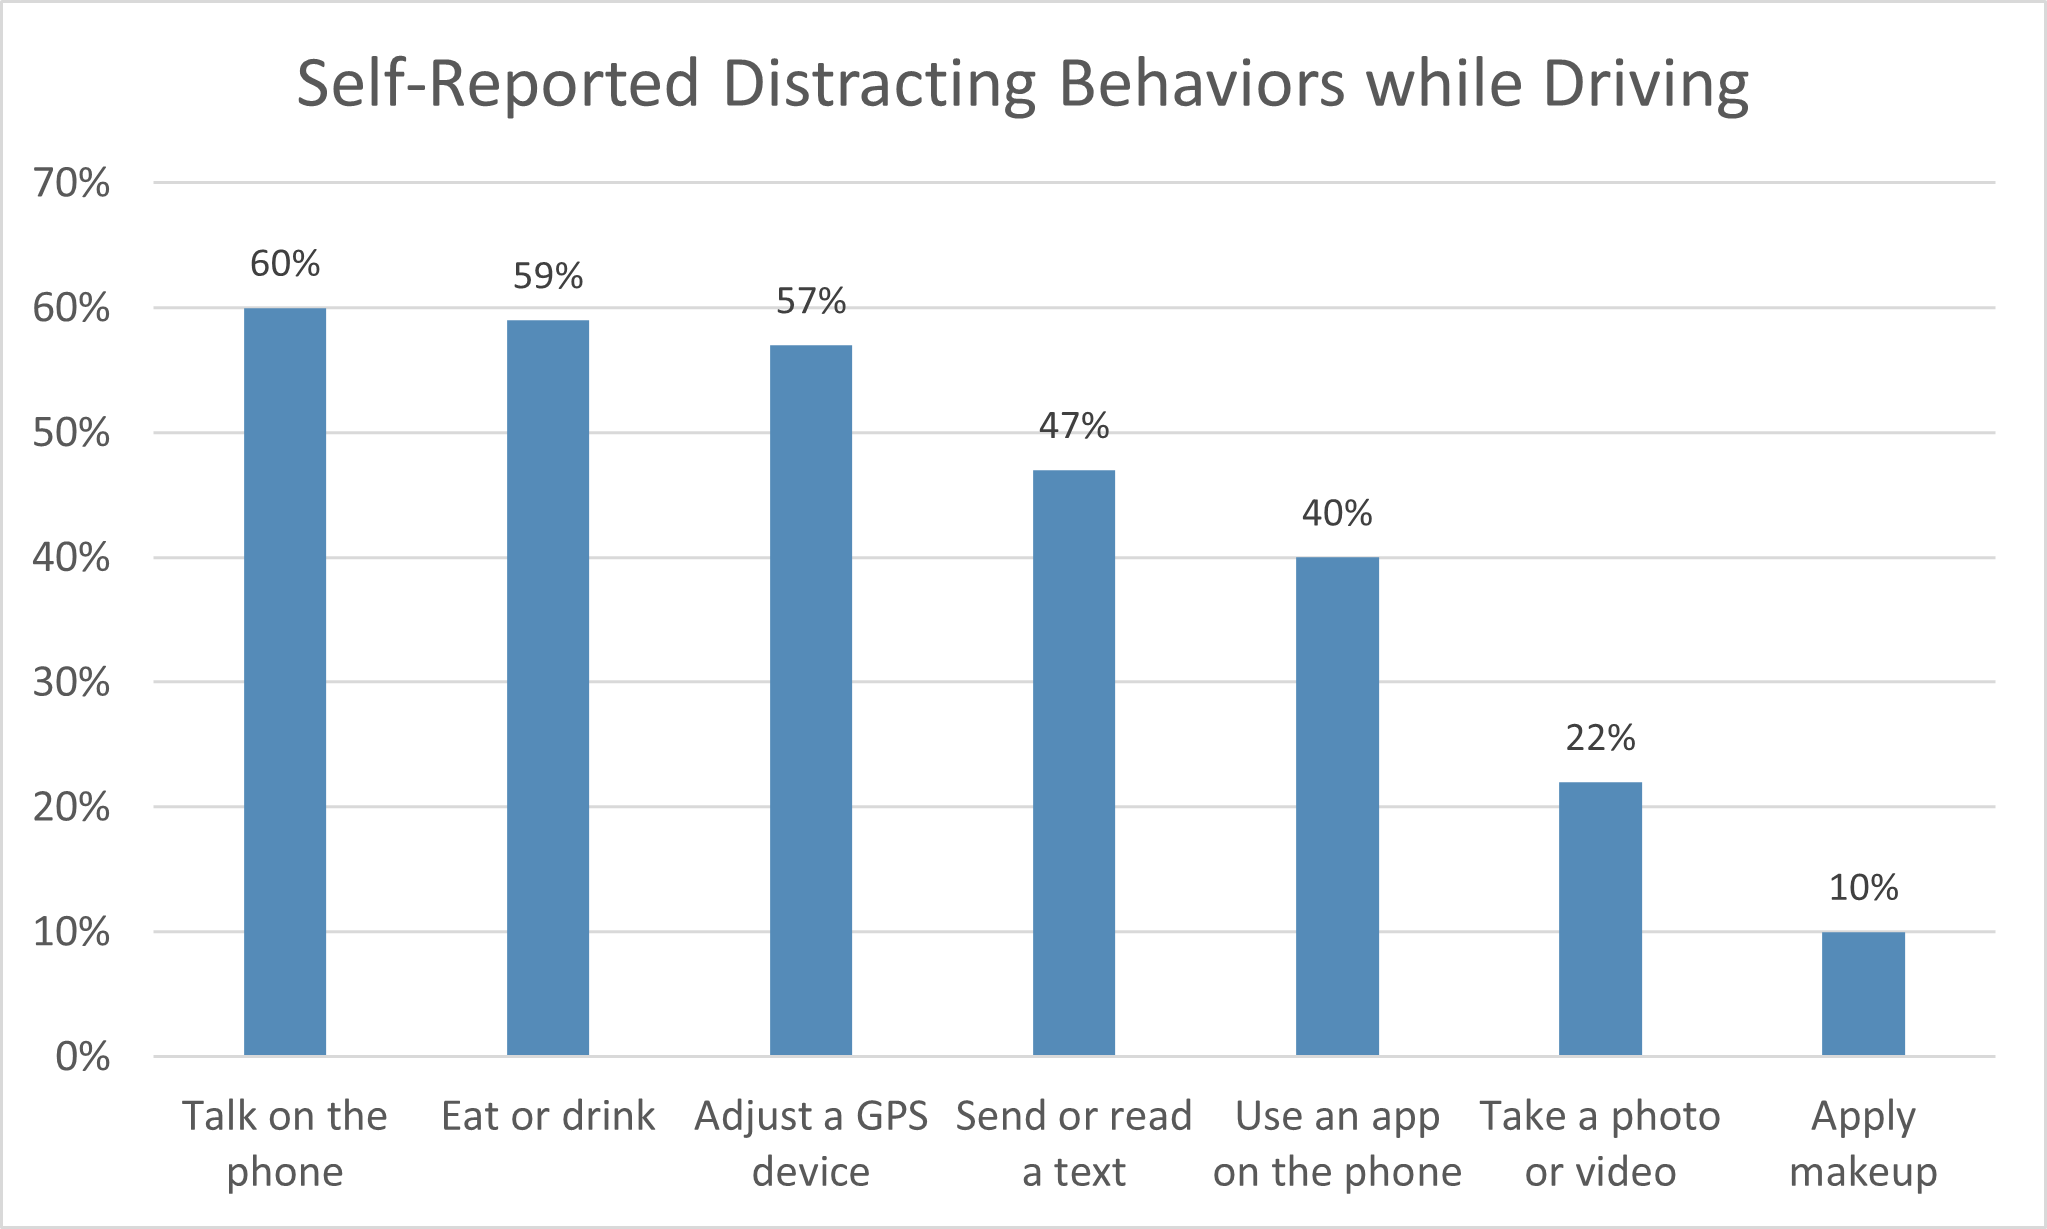
- A study conducted in 2017 found that programming GPS navigation was even more distracting to drivers than texting. It took an average of 40 seconds to complete the programming of GPS navigation plus 13 more seconds for the brain to refocus after completing the task. (AAA Exchange, 2025)
- In a 2024 survey of 421 fleet professionals in Australia, New Zealand, Mexico, the United Kingdom, and the United States, 61% of respondents stated that distracted driving had directly impacted their businesses in the following ways. (The Trucker, January 2025)
- Directly impacted their financial costs: nearly 49%
- Disrupted operations: 40%
- Led to safety and compliance breaches: 28%
- Damaged their organizations’ reputations: 25%
- As of April 2025, 34 states and Washington, DC ban the use of hand-held cell phones to call or text while driving. 36 states and Washington, DC ban the use of all cell phones (both hand-held and hands-free) by novice drivers. (Governors Highway Safety Association, April 2025) However, as cell phones have become more capable and other electronic devices have become popular, drivers are increasingly using them for purposes unrelated to calling or texting. As of April 2025, only 17 states ban drivers of all ages from using hand-held devices (not just cell phones) for any purpose. (IIHS, April 2025)
Texting and Driving Accident Statistics
- In 2021, a nationwide observational study of driver use of electronic devices from 7 a.m. to 6 p.m. found that 7.6% of drivers were using a cell phone (either hand-held or hands-free) at any given moment. Observed cell phone use while driving was higher among female drivers, younger drivers, drivers in urban areas, and drivers who were not carrying passengers. (NHTSA, 2022)
- Texting while driving increases the risk of crashing by 23 times. (NHTSA, 2018)
- Texting increases your chances of rear-ending someone by a factor of 7. (AAA Foundation for Traffic Safety, 2018)
- In a nationwide survey of 2,739 active licensed drivers ages 16 and older in 2023, 26.6% of drivers admitted that they had typed or sent email or a text message on a cell phone while driving within the past 30 days. 37.0% of the drivers admitted that they had read an email or a text message on a cell phone while driving within the past 30 days. (AAA Foundation for Traffic Safety, December 2024)
Alcohol-Impaired Driving Statistics
- In 2023, 12,429 people died in drunk-driving traffic crashes. That works out to an average of one fatality every 42 minutes. (Fatality Analysis Reporting System, NHTSA, accessed April 2025)
- From 2014 to 2023, an average of 11,000 people were killed in drunk-driving crashes each year. (Fatality Analysis Reporting System, NHTSA, accessed April 2025)
- In 2022, about 32% of traffic crash fatalities involved drunk drivers: drivers whose blood alcohol concentration (BAC) was 0.08% or higher. (NHTSA, August 2024)
- In all states, it is illegal to drive a vehicle while your blood alcohol concentration (BAC) is 0.08% or higher. In Utah, the legal blood alcohol limit is stricter: 0.05%. (Governors Highway Safety Association) For commercial drivers, the federal BAC limit (which applies to all states) is stricter still: 0.04%. (49 CFR 383.51)
- The percentage of total traffic fatalities due to drunk driving varies by state. In 2022, Utah and West Virginia had the lowest percentages (22% and 23% respectively); Rhode Island and South Carolina had the highest percentages (43% each).
- In 2022, the national rate of alcohol-impaired (0.08% BAC or higher) driving fatalities was 0.42 per 100 million vehicle miles traveled (VMT). That may not sound like a lot, until you realize that Americans drove a total of 3.2 trillion miles that year. (NHTSA, August 2024)
- In 2022, 31% of passenger vehicle drivers who died in traffic crashes had a blood alcohol content (BAC) of 0.08% or higher (the legal threshold for intoxication). However, this figure represents a significant decline from 1982, when 51% of passenger vehicle drivers who died were legally intoxicated. Similar declines took place for motorcycle drivers (from 48% to 29%), large truck drivers (from 17% to 4%), and pedestrians ages 16 and older (from 45% to 30%). See the following chart. (IIHS, June 2024)
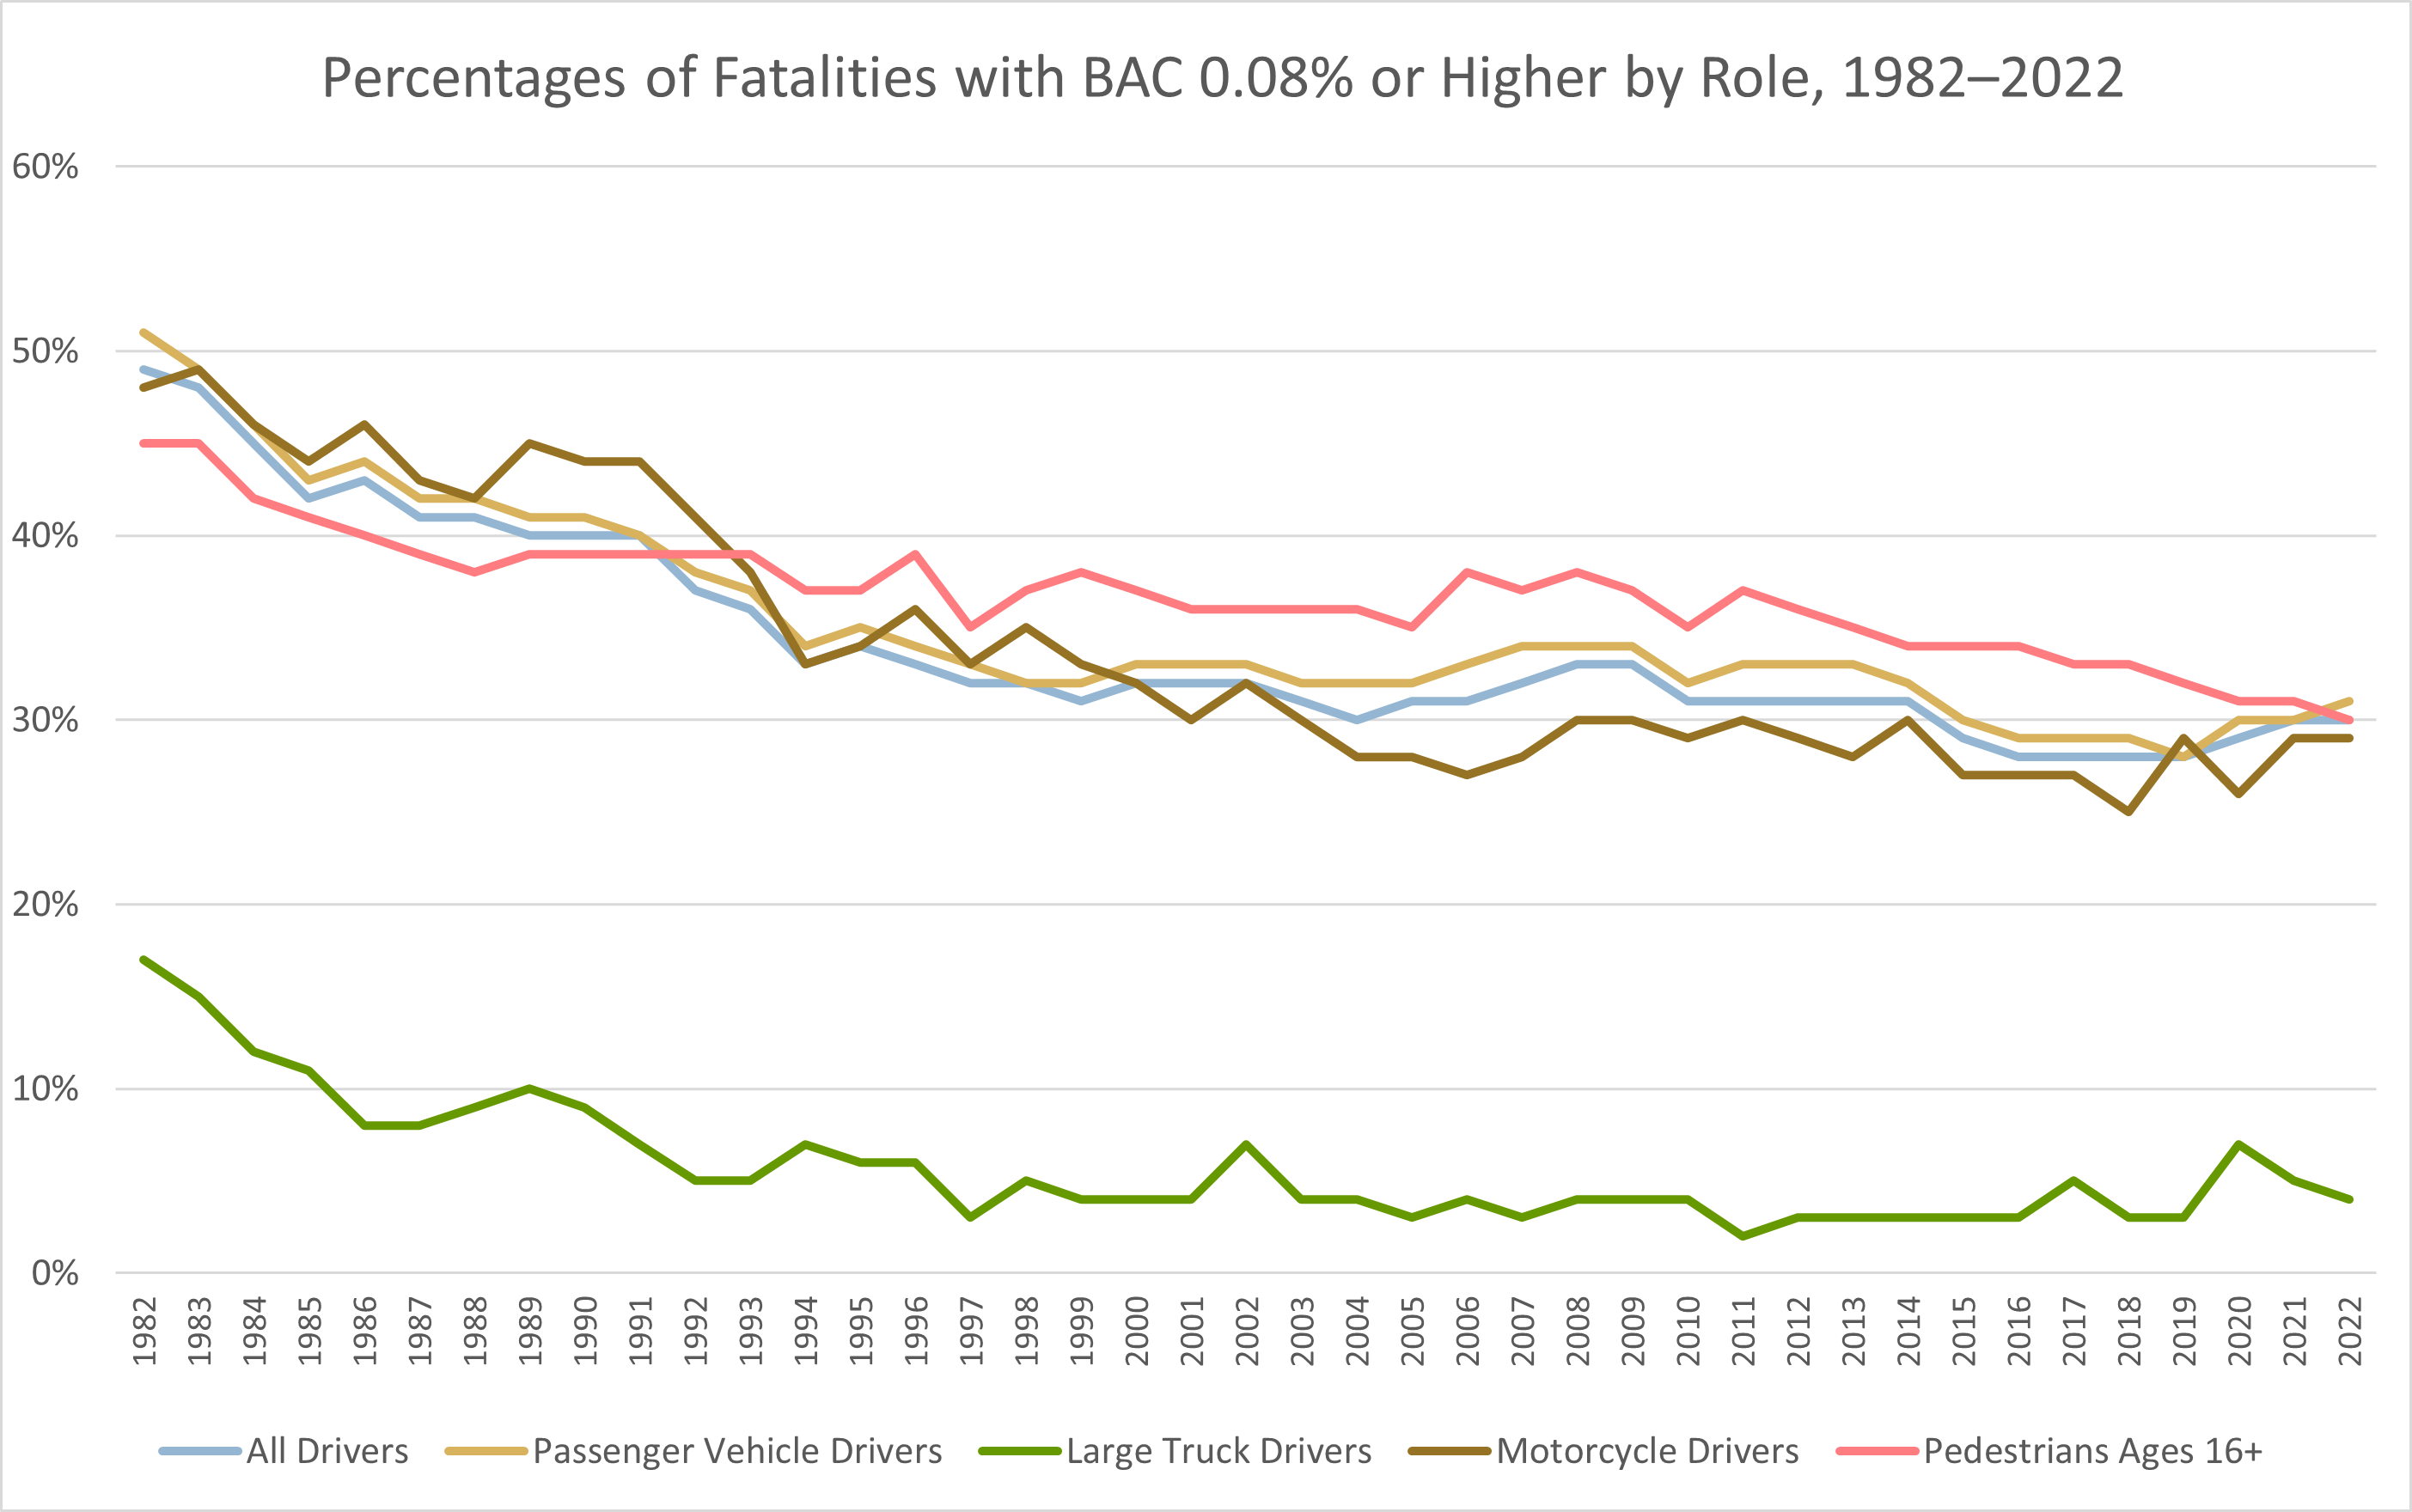
- The Insurance Institute for Highway Safety (IIHS) and the Highway Loss Data Institute (HLDI) have calculated that 10,812 lives could have been saved in 2019–2022 if all drunk drivers (i.e., those with BACs of 0.08% or higher) had been kept off the roads. (IIHS, July 2024)
- One study found that each 0.02% increase in the BAC of male drivers ages 16–20 more than doubled their risk of a crash. For a BAC of 0.09% (slightly over the legal threshold for intoxication), the risk of a single-vehicle crash increased by a factor of 11.4 for drivers ages 35 and older, and by a factor of 51.9 for male drivers ages 16–20. (Zador, P. L., et al., May 2000)
- For nearly the entire 20th century, the legal blood alcohol threshold for intoxication was typically 0.10% but was higher in some states. From 2000 to 2005, all states lowered the threshold to 0.08%. The Centers for Disease Control and Prevention (CDC) found that lowering the threshold reduced alcohol-related traffic fatalities by about 7%. (IIHS, July 2024)
- In 2018, Utah lowered its blood alcohol threshold to 0.05%. A study found that from 2016 to 2019, lowering the threshold was largely responsible for reducing the fatal crash rate per 100 million vehicle miles traveled (VMT) by 19.8%. It was also responsible for reducing the crash fatality rate per 100 million VMT by 18.3% during that same period. These figures compare with reductions of 5.6% and 5.9% respectively in the rest of the nation during that same period. (NHTSA, February 2022)
- In a roadside breathalyzer survey conducted in 2013–2014, NHTSA found that 1.5% of the drivers surveyed had blood alcohol concentrations (BACs) of 0.08% or higher. This percentage of drivers was substantially lower than in 1973, when 7.5% of the drivers surveyed had BACs of 0.08% or higher. (IIHS, July 2024)
- In 2022, a random testing survey of commercial drivers holding commercial driver’s licenses (CDLs) found that 0.29% of surveyed drivers tested positive for a blood alcohol concentration (BAC) of 0.04% or higher, and 0.9% tested positive for drugs. That same year, post-crash testing found that 0.17% of commercial drivers involved in crashes tested positive for a BAC of 0.04% or higher, and 1.7% tested positive for drugs. (It is illegal for a CDL holder to operate a commercial motor vehicle with a BAC of 0.04% or higher.) (FMCSA, April 2024)
- In 2022, 32% of all traffic fatalities involved alcohol-impaired driving, where the highest blood alcohol concentration (BAC) among drivers involved in each crash was 0.08% or higher. (NHTSA, August 2024)
- In 2022, there were 13,524 alcohol-impaired driving fatalities. 9,047 (66.9%) of these fatalities occurred in crashes in which at least one driver’s blood alcohol concentration (BAC) was 0.15% or higher – nearly twice the legal alcohol threshold. (NHTSA, August 2024)
- In 2022, law enforcement agencies arrested an estimated 895,000 drivers on suspicion of driving under the influence. In 2023, there were an estimated 880,000 DUI arrests, continuing a long-term decline since the 1,050,000 DUI arrests in 2015. (There was a sharp but temporary dip to some 443,000 DUI arrests in 2021 during the COVID pandemic.) (Gerald Miller, P.A., May 2025)
- In 2022, 32% of drivers involved in fatal crashes were alcohol impaired, compared with 11% during the day. Among drivers involved in fatal crashes, alcohol impairment was much higher on weekends (29%) than on weekdays (17%). (NHTSA, August 2024)
- In 2022, 33% of drivers involved in fatal single-vehicle crashes were alcohol impaired, compared with 15% of drivers involved in fatal multi-vehicle crashes. (NHTSA, August 2024)
- In a survey of 2,739 active licensed drivers conducted in 2023, 7.4% of them admitted to having driven at least once within the past 30 days while their blood alcohol concentrations (BACs) were likely over the legal limit. 0.2% of drivers admitted to doing it regularly or fairly often. (AAA Foundation for Traffic Safety, December 2024)
- The total cost of all motor vehicle traffic crashes in 2019 was estimated at $340 billion, of which alcohol-impaired crashes cost $58 billion. These figures do not include the additional costs associated with the lost quality of life resulting from crash injuries. (NHTSA, August 2024)
- In 2022, there were 9,914 male alcohol-impaired drivers involved in fatal crashes and 2,562 female alcohol-impaired drivers involved in crashes, a ratio of 3.87 to 1. (NHTSA, August 2024)
- The following chart depicts age distributions of alcohol-impaired (BAC 0.08% or higher) drivers involved in fatal crashes. Two age distributions are shown: (1) each age group of alcohol-impaired drivers as a percentage of total alcohol-impaired drivers, and (2) each age group of alcohol-impaired drivers in fatal crashes as a percentage of all drivers of that age group in fatal crashes. 26.9% of all alcohol-impaired drivers were aged 25–34, the most of all age groups shown. However, 29.3% of drivers aged 21–24 involved in fatal crashes were alcohol impaired, the most of all age groups shown. (NHTSA, August 2024)
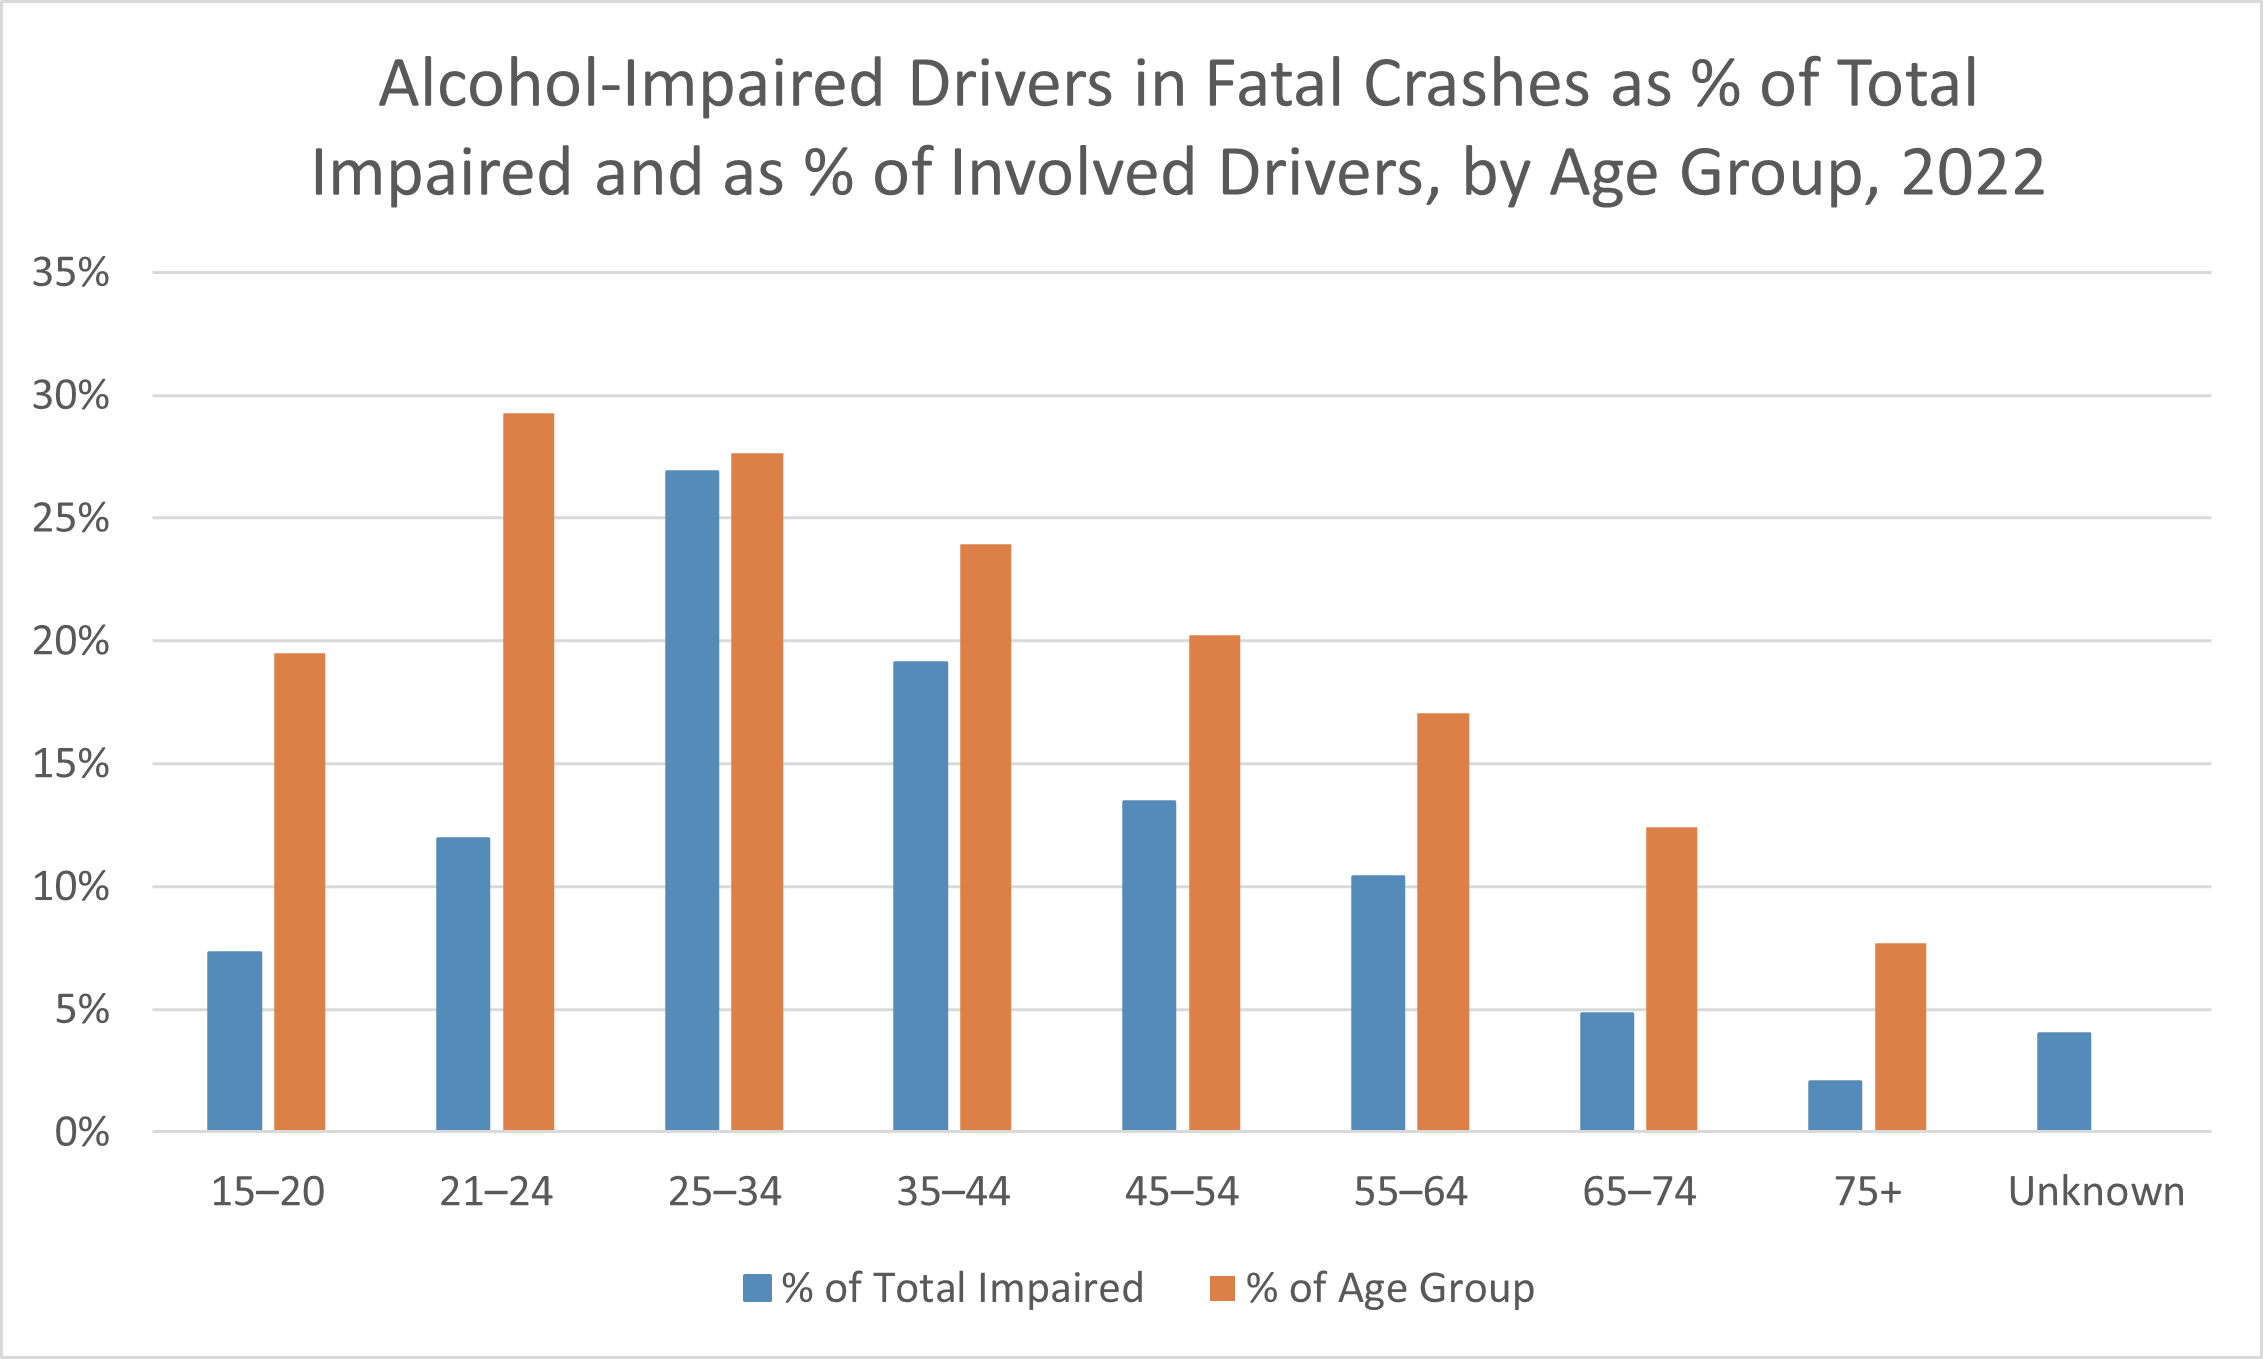
- Among persons killed in motor vehicle crashes in 2022, 2% of the large truck drivers, 23% of the passenger vehicle drivers, 18% of the motorcyclists, and 23% of the pedestrians ages 16 and older had a blood alcohol concentration (BAC) of at least 0.15% – nearly twice the legal threshold for intoxication. (IIHS, June 2024)
- Among passenger vehicle drivers killed in motor vehicle crashes in 2022, 28% of those aged 16–20 and 44% of those aged 21–30 had a blood alcohol concentration (BAC) at or above 0.08% (which qualifies as legal intoxication). See the following chart. (IIHS, June 2024)
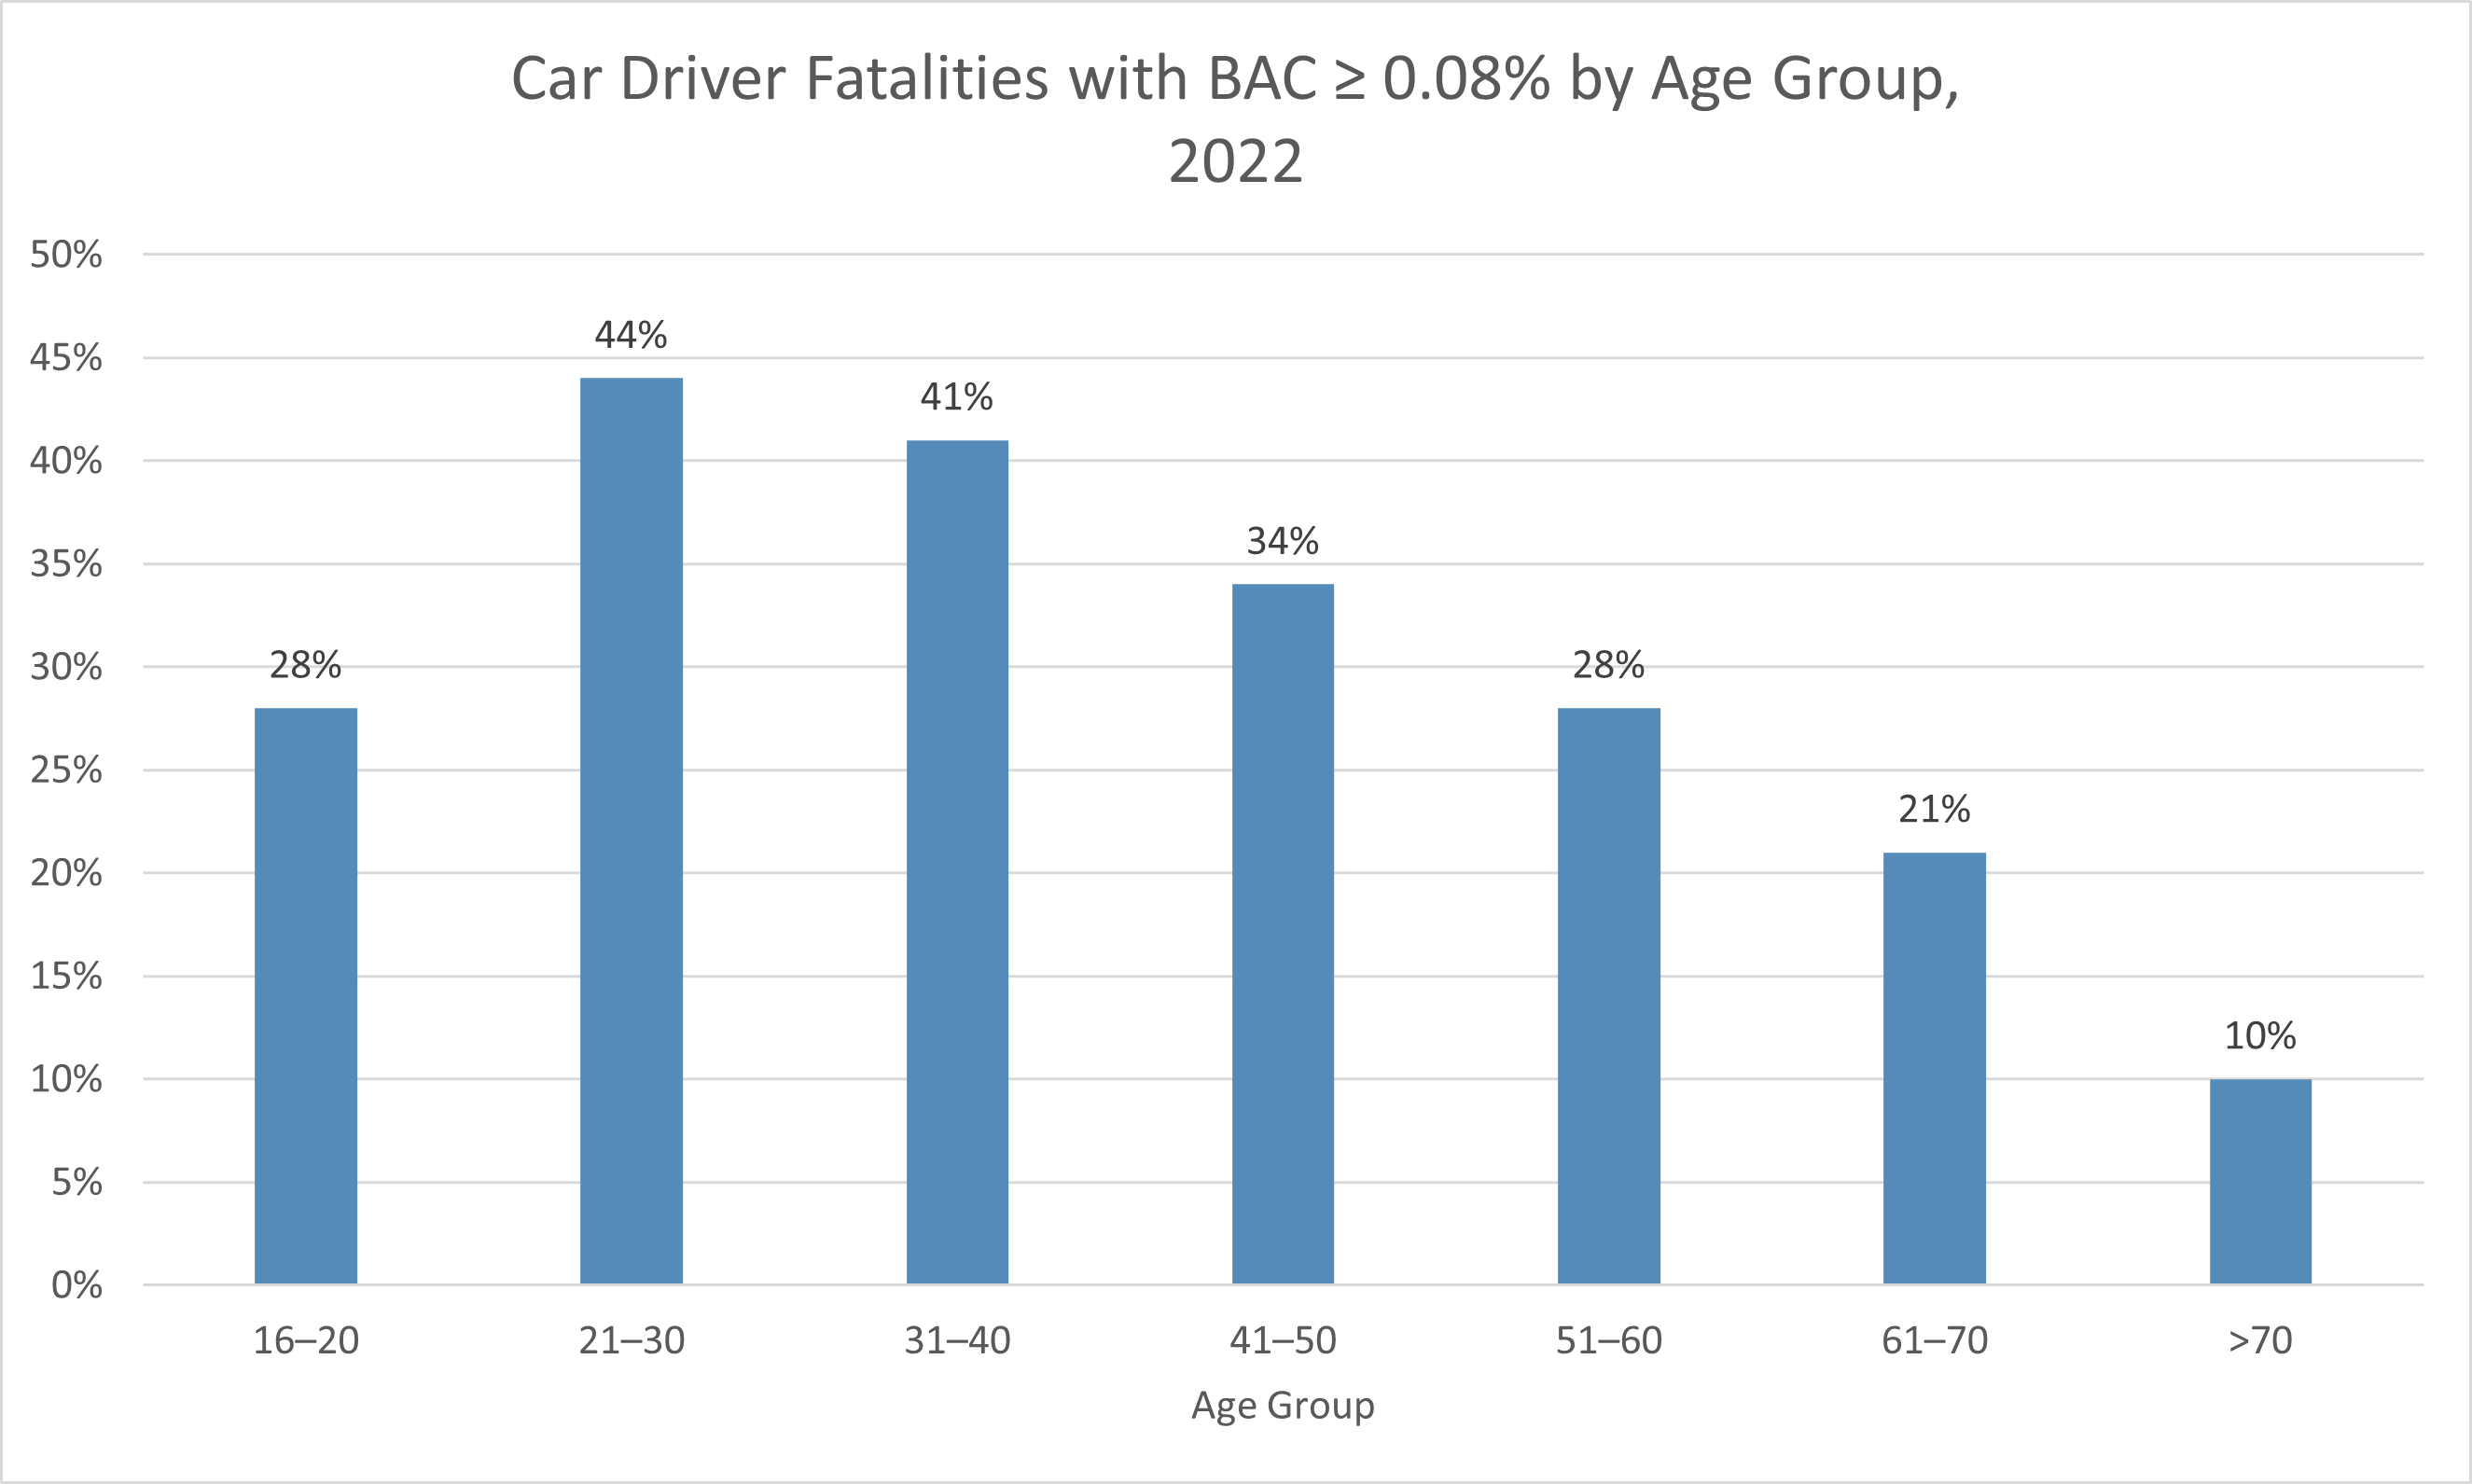
- Among drivers involved in fatal wrong-way crashes on divided highways in 2010-2018, 60.1% of the wrong-way drivers had blood alcohol concentrations (BACs) of 0.08% or more, compared with 11.0% for the right-way drivers. (A BAC of 0.08% qualifies as legal intoxication.) (AAA Foundation for Traffic Safety, 2021)
- In 2022, 59.2% of the fatalities in fatal drunk-driving crashes were the drunk drivers themselves. Only 12.1% of the fatalities were nonoccupants of vehicles, such as bicyclists and pedestrians. (Note that other statistics have shown that some of these nonoccupant fatalities were intoxicated at the time.) See the following chart. (NHTSA, August 2024)
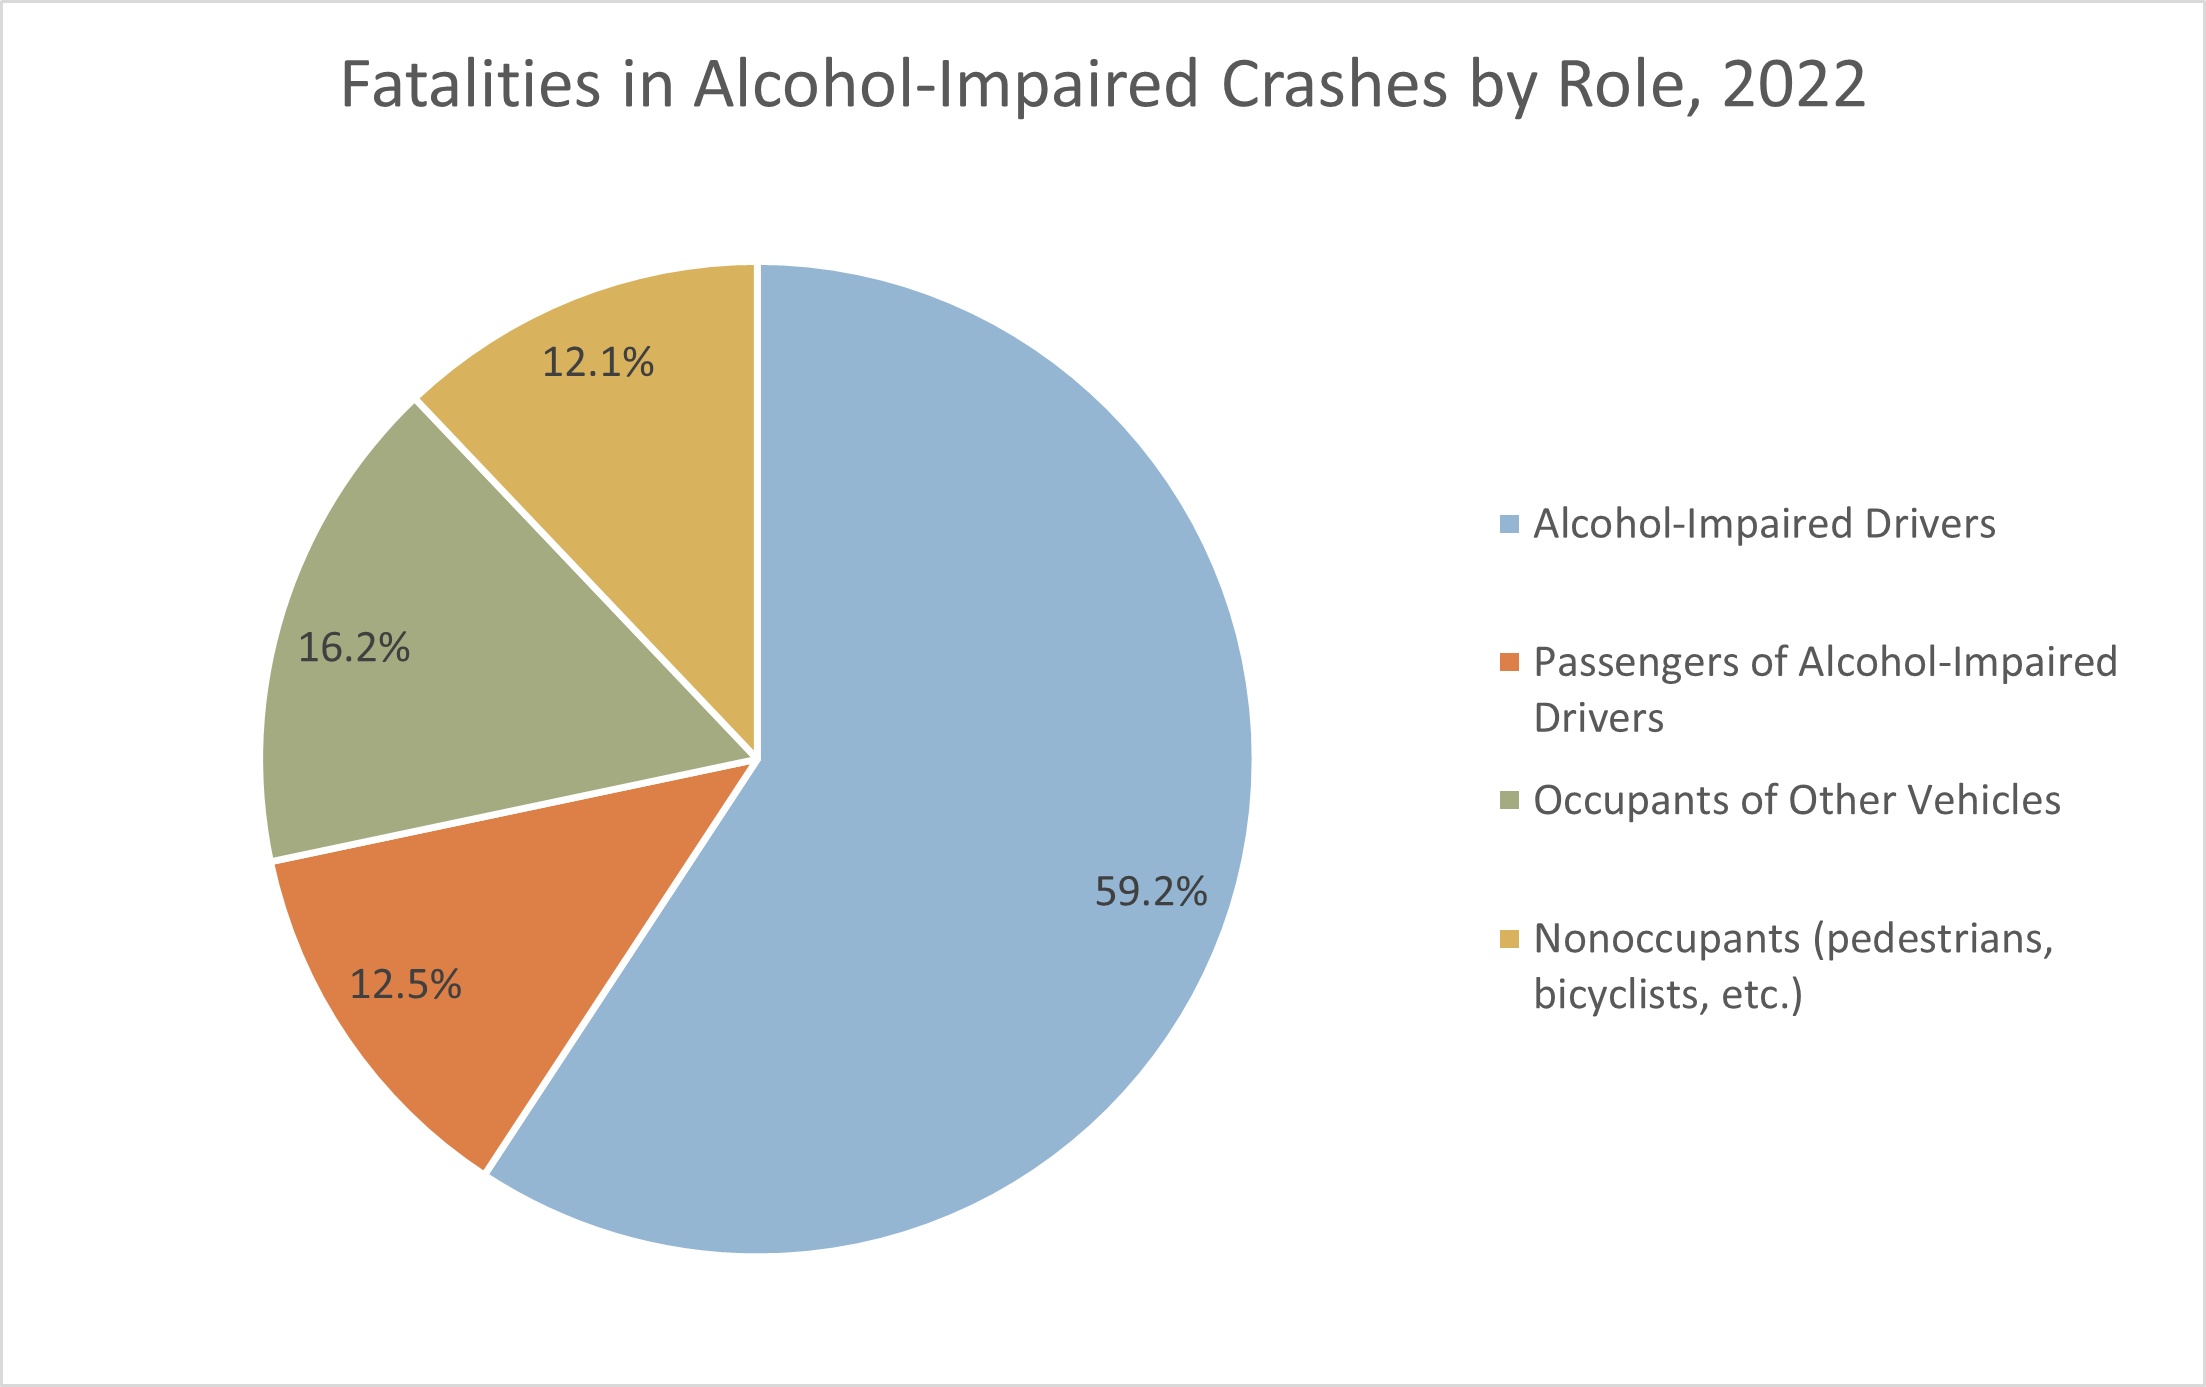
- Among car drivers who were alcohol-impaired and killed in crashes in 2022, 64% were unrestrained (not wearing seat belts). (NHTSA, August 2024)
- Young drivers are more impaired by alcohol than older drivers. For drivers aged 16–20, the chance of a fatal crash with a blood alcohol concentration (BAC) of 0.08% is 10 times as high as with a BAC of zero. For drivers aged 21–34, it's 7 times as high; for drivers aged 35 and older, it's 6 times as high. (IIHS, July 2024)
- A national roadside survey of drivers in 2013–2014 measured the breath alcohol concentration (BrAC) of randomly selected drivers. The survey found that 1.5% of drivers had BrACs at or above 0.08% (which constituted legal intoxication). This compares with 7.5% in a 1973 survey. (IIHS, 2021)
- It is estimated that 25% of crash deaths could be prevented if all motor vehicle drivers with blood alcohol concentrations (BACs) of 0.08% or more were prevented from driving. (IIHS, 2021)
- It is estimated that 0.08% of commercial drivers have a blood alcohol concentration (BAC) of at least 0.04% (the legal limit for commercial drivers) while on the road. (The standard error of this estimate is 0.03%.) Furthermore, it is estimated that 0.8% of commercial drivers have used drugs while on the road. (The standard error for this estimate is 0.3%.) (FMCSA, 2019)
- In 2022, about 28% of motorcyclists involved in fatal crashes had a blood alcohol concentration (BAC) of 0.08% or higher. This compares with 25% of drivers of passenger cars, 21% of drivers of light trucks, and just 3% of drivers of large trucks involved in fatal crashes who were comparably intoxicated. (NHTSA, August 2024)
- Of the 1,012 bicyclists killed in 2022, 208 (20.6%) had a blood alcohol concentration (BAC) at or above 0.08% (meaning they were legally intoxicated at the time). (IIHS, June 2024)
- In 2022, 37.1% of pedestrians 16 and older who were killed in crashes at night (9 p.m. to 6 a.m.) had blood alcohol concentrations (BACs) at or above 0.08% (the legal limit), compared with 61.4% in 1982. From 6 a.m. to 9 p.m., 22.8% of pedestrian fatalities had BACs at or above 0.08%, compared with 26.9% in 1982. (IIHS, June 2024)
- In 2022, about 48% of all crashes resulting in pedestrian fatalities involved either a driver or pedestrian with a blood alcohol concentration (BAC) of 0.08% or higher. (NHTSA, July 2024)
- In 21.8% of crashes in 2022 in which a pedestrian was struck and killed by a vehicle, the pedestrian – not the driver – had a blood alcohol concentration (BAC) of 0.08% or greater (which constituted legal intoxication). This compares with 11.3% of fatal pedestrian crashes in which the driver, not the pedestrian, was legally intoxicated; and 6.1% of fatal pedestrian crashes in which both the pedestrian and the driver were legally intoxicated. See the following table. (NHTSA, July 2024)
|
Percentage of Pedestrian Fatal Crashes, by Alcohol Involvement of Drivers and Pedestrians, 2022 |
||||
|
Pedestrian Status |
Driver, No Alcohol |
Driver, BAC 0.01–0.07 |
Driver, BAC 0.08+ |
Driver Total |
|
Pedestrian, No Alcohol |
52.3% |
2.6% |
11.3% |
66.2% |
|
Pedestrian, BAC 0.01–0.07 |
3.1% |
0.2% |
0.9% |
4.2% |
|
Pedestrian, BAC 0.08+ |
21.8% |
1.6% |
6.1% |
29.5% |
|
Total Crashes |
77.2% |
4.4% |
18.4% |
100.0% |
- A 2020 study by the Insurance Institute for Highway Safety (IIHS) estimated that if alcohol detection technology were added to all new vehicles, more than 9,400 lives could be saved each year. An alcohol detection device can detect the driver's blood alcohol concentration (BAC) and prevent the vehicle from starting if the driver's BAC is at or above 0.08%. (DADSS, accessed May 2025)
Drug-Impaired Driving Statistics
- In the 2023 National Survey on Drug Use and Health, 36.2% of people ages 12 and older reported using marijuana during the past month, a significant increase from 2022. 61.3%– a clear majority – of respondents ages 12 to 17 reported using marijuana within the past month. (SAMHSA, July 2024)
- From October to December 2020, 56% of drivers involved in traffic crashes causing death or serious injury tested positive for at least one drug capable of impairing driving. (NHTSA, accessed April 2025)
- Second only to alcohol, delta-9-tetrahydrocannabinol (THC, the active ingredient in marijuana) is the drug most often found in the blood of people injured or killed in traffic crashes. 25% of these people tested positive for cannabis, 11% tested positive for stimulants, and 9% tested positive for opioids. (GHSA, January 2024)
- Among drug-positive drivers killed in crashes in 2016, 4% tested positive for both marijuana and opioids, 16% for opioids only, 38% for marijuana only, and 42% for other drugs. (Governors Highway Safety Association, 2017)
- However, there is as yet little reliable evidence for a significant association between cannabis consumption and elevated real-world crash risk. Some studies that claimed to show this were poorly controlled. A 2016 study of 3,000 drivers involved in crashes and 6,000 control drivers (not involved in crashes) adjusted for the variables of age, sex, race/ethnicity, and concurrent alcohol consumption. The adjusted odds ratio (adjusted relative crash risk) of the presence of delta-9-tetrahydrocannabinol (THC) (the active ingredient in marijuana) was 1.00, meaning that THC did not significantly affect the odds of a crash. Neither did any other drug considered in this study besides alcohol. (The adjusted relative crash risk for a BAC of 0.08% was found to be 3.93, which was statistically significant.) (Lacey, J. H., et al., December 2016)
|
Drug |
Adjusted Crash Risk |
95% Confidence Interval |
|
THC |
1.00 |
[0.83, 1.22] |
|
Antidepressants |
0.86 |
[0.56, 1.33] |
|
Narcotic analgesics |
1.17 |
[0.87, 1.56] |
|
Sedatives |
1.19 |
[0.86, 1.64] |
|
Stimulants |
0.92 |
[0.70, 1.19] |
|
Illegal drugs |
0.99 |
[0.84, 1.18] |
|
Medications |
1.02 |
[0.83, 1.26] |
- Taking 50 mg of diphenhydramine (a popular over-the-counter antihistamine) can impair one’s driving more than a blood alcohol concentration (BAC) of 0.10%. (The legal intoxication threshold for BAC is 0.08% in most US states.) (University of Iowa, 2000) A subsequent study found that taking 50 mg of diphenhydramine significantly (P-value < 0.001) increased drivers’ standard deviation of lateral position (SDLP). SDLP is a widely used scientific metric of driving ability, which measures the amount of drift or weaving of a vehicle within its lane. (Maastricht University, The Netherlands, 2004)
- A study found that taking benzodiazepine medications (such as Valium or Xanax) increases the driver's chance of a vehicle crash by 60–80%, compared with not taking these medications. Taking benzodiazepines along with alcohol makes it 7.7 times as likely that the driver will be involved in a crash. (University of Newcastle, 2011)
- As of January 2024, in 14 states, it is illegal to drive with any detectable level of THC (tetrahydrocannabinol, the active ingredient in marijuana) in your blood. In 5 other states, it is illegal to drive with a THC level of 5 nanograms per milliliter of blood. (Governors Highway Safety Association, January 2024)
Illness-Impaired Driving Statistics
- Studies have shown that the common cold can slow a driver's reaction time by about 10% and make it significantly less likely that the driver will be able to identify moving objects that may cause a collision. This level of impairment is roughly comparable to the effects of a blood alcohol concentration (BAC) of 0.08% (which constitutes legal intoxication in all US states). These effects do not include possible additional driving impairment from medications taken to treat the common cold. (Cardiff University, 2012)
- A literature-review study investigated the effects of common chronic health conditions on estimated driving performance. Some of the findings are summarized in the following table. The crash risk odds ratio of a health condition is the factor by which the crash risk is multiplied, compared with not having the condition. For example, an odds ratio of 2.00 would mean that the health condition doubles the sufferer’s crash risk. Most of these health conditions have a range of odds ratios, depending on the severity of the condition or the age of the patient. Some odds ratios were calculated to two decimal places, but others to only one. These health conditions tend to be more prevalent in older people, which is concerning as the US population ages. (Lococo, K. H. et al., July 2018)
|
Health Condition |
Crash Risk Odds Ratio |
|
Arthritis (unrestricted drivers) |
1.59 – 4.51 |
|
Cataracts |
2.5 – 2.7 |
|
Dementia |
2.00 – 4.23 |
|
Glaucoma |
3.60 – 6.0 |
|
Hepatic encephalopathy |
4.51 – 5.77 |
|
Hypoglycemia caused by diabetes or diabetes medications |
1.04 – 3.24 |
|
Macular degeneration |
3.3 |
|
Multiple sclerosis with cognitive impairment |
9.1 |
|
Obstructive sleep apnea |
1.30 – 6.3 |
|
Parkinson’s disease |
1.42 – 7.5 |
|
Stroke or transient ischemic attack (TIA) |
2.7 |
- In comparison, the crash risk odds ratio of a blood alcohol concentration (BAC) of 0.08% is 2.7 – 4.5.
Drowsy Driving Statistics
- The CDC recommends that adults get at least 7 hours of sleep every day. (Centers for Disease Control and Prevention, May 2024)
- A 2022 telephone survey of over 400,000 adults (ages 18 and older) found that 36.8% of these surveyed adults (37.5% of males, 36.0% of females) sleep less than the recommended seven hours daily. (Centers for Disease Control and Prevention, May 2024)
- In a survey of 2,739 drivers in 2023, 19.5% of them admitted to driving while they were so tired that it was hard to keep their eyes open. 0.8% of them admitted to doing it regularly or fairly often. (See also the section DUI/Impaired Driving Statistics.) (AAA Foundation for Traffic Safety, December 2024)
- It is estimated that in 2017, 91,000 police-reported crashes involved drowsy drivers. These crashes led to an estimated 50,000 people injured and nearly 800 deaths. However, most authorities agree that most such figures on drowsy driving are likely underestimates. Unlike alcohol intoxication, there is no reliable, objective medical test for drowsiness. (NHTSA, accessed May 2025)
- In 2023, 633 people were killed in crashes involving a drowsy driver. This figure represents about 1.5% of all motor vehicle traffic crash fatalities. Again, however, these figures were likely underestimates. (NHTSA, accessed April 2025)
- Using data from 11,268 fatal crashes from 2017 to 2021, researchers created and backtested a model to determine whether drowsy driving was a factor in a fatal crash. According to this model, in 2017–2021, an estimated 17.6% of fatal crashes and an estimated 29,834 fatalities were due to drowsy driving. (AAA Foundation for Traffic Safety, March 2024)
- A study of 6,845 drivers involved in crashes in 2005–2007 found that compared with getting 7 to 9 hours of sleep, getting only 4 hours of sleep increased the risk of a crash by a factor of 2.9, and getting less than 4 hours of sleep increased crash risk by a factor of 15.1. (Tefft, Brian C., October 2018)
- A study conducted in 2010–2013 of the behavior of more than 3,500 drivers found that driver drowsiness was a factor in 8.8–9.5% of all vehicle crashes and 10.6–10.8% of vehicle crashes that resulted in major property damage, airbag deployment, or injury. Driver drowsiness was a factor in 17.7% of the crashes that occurred in darkness. (A driver was considered drowsy if his or her eyes were closed at least 12 % of the time during his or her monitoring period.) (AAA Foundation for Traffic Safety, 2018)
- A study of 1,892 crash or near-crash (CNC) events found that sleep work shift disorder (SWSD) increased the risk of a CNC event by a factor of 2.96 (i.e., the risk tripled) compared with drivers who did not have a sleep disorder. In comparison, sleep apnea increased CNC risk by a factor of 1.89. (Bharadwaj, Nipjyoti et al., 2021)
- Analysis of a sample of 4,571 crashes that occurred from July 2005 to December 2007 revealed that elevated crash risk was associated with fewer hours of sleep in the 24 hours before a crash. Drivers who reported less than 4 hours, 4 to 5 hours, 5 to 6 hours, and 6 to 7 hours of sleep in the past 24 hours were associated with a 11.5, 4.3, 1.9, and 1.3 times increase in crash rate respectively, than drivers who reported sleeping at least 7 hours of sleep. (AAA Foundation for Traffic Safety, 2016)
- Sleeping only 4–5 hours in a 24-hour period increases a driver's crash risk as much as a blood alcohol concentration (BAC) of 0.05%. Getting less than 4 hours of sleep increases crash risk as much as a BAC of roughly 0.12%. (The threshold for legal intoxication is currently 0.05% in Utah and 0.08% in all other states.) These are BACs typically reached by consuming 3–4 (for males) or 2–3 (for females) alcoholic drinks. Most healthy adults are unfit to drive with only 3–5 hours of sleep in the previous 24 hours. (National Sleep Foundation, October 2024)
- A survey in September 2024 asked 1,372 adults what they would do about driving if they had consumed a few alcoholic drinks or had only slept for 3–4 hours the night before. Compared with having consumed alcohol, significantly fewer respondents would try to change their plans (say by taking alternative transportation) to avoid driving after having slept for just 3–4 hours of sleep. Interestingly, fewer than half of respondents indicated that alternative transportation would be available in case of inadequate sleep – even though a strong majority indicated that it would be available in case of intoxication. Thus, after inadequate sleep, far more respondents would drive anyway, even though the degree of driving impairment is roughly the same. However, the percentages of respondents who would discourage some other impaired driver from driving were roughly the same whether the impairment stemmed from drowsiness or alcohol consumption. See the following chart. (National Sleep Foundation, October 2024)
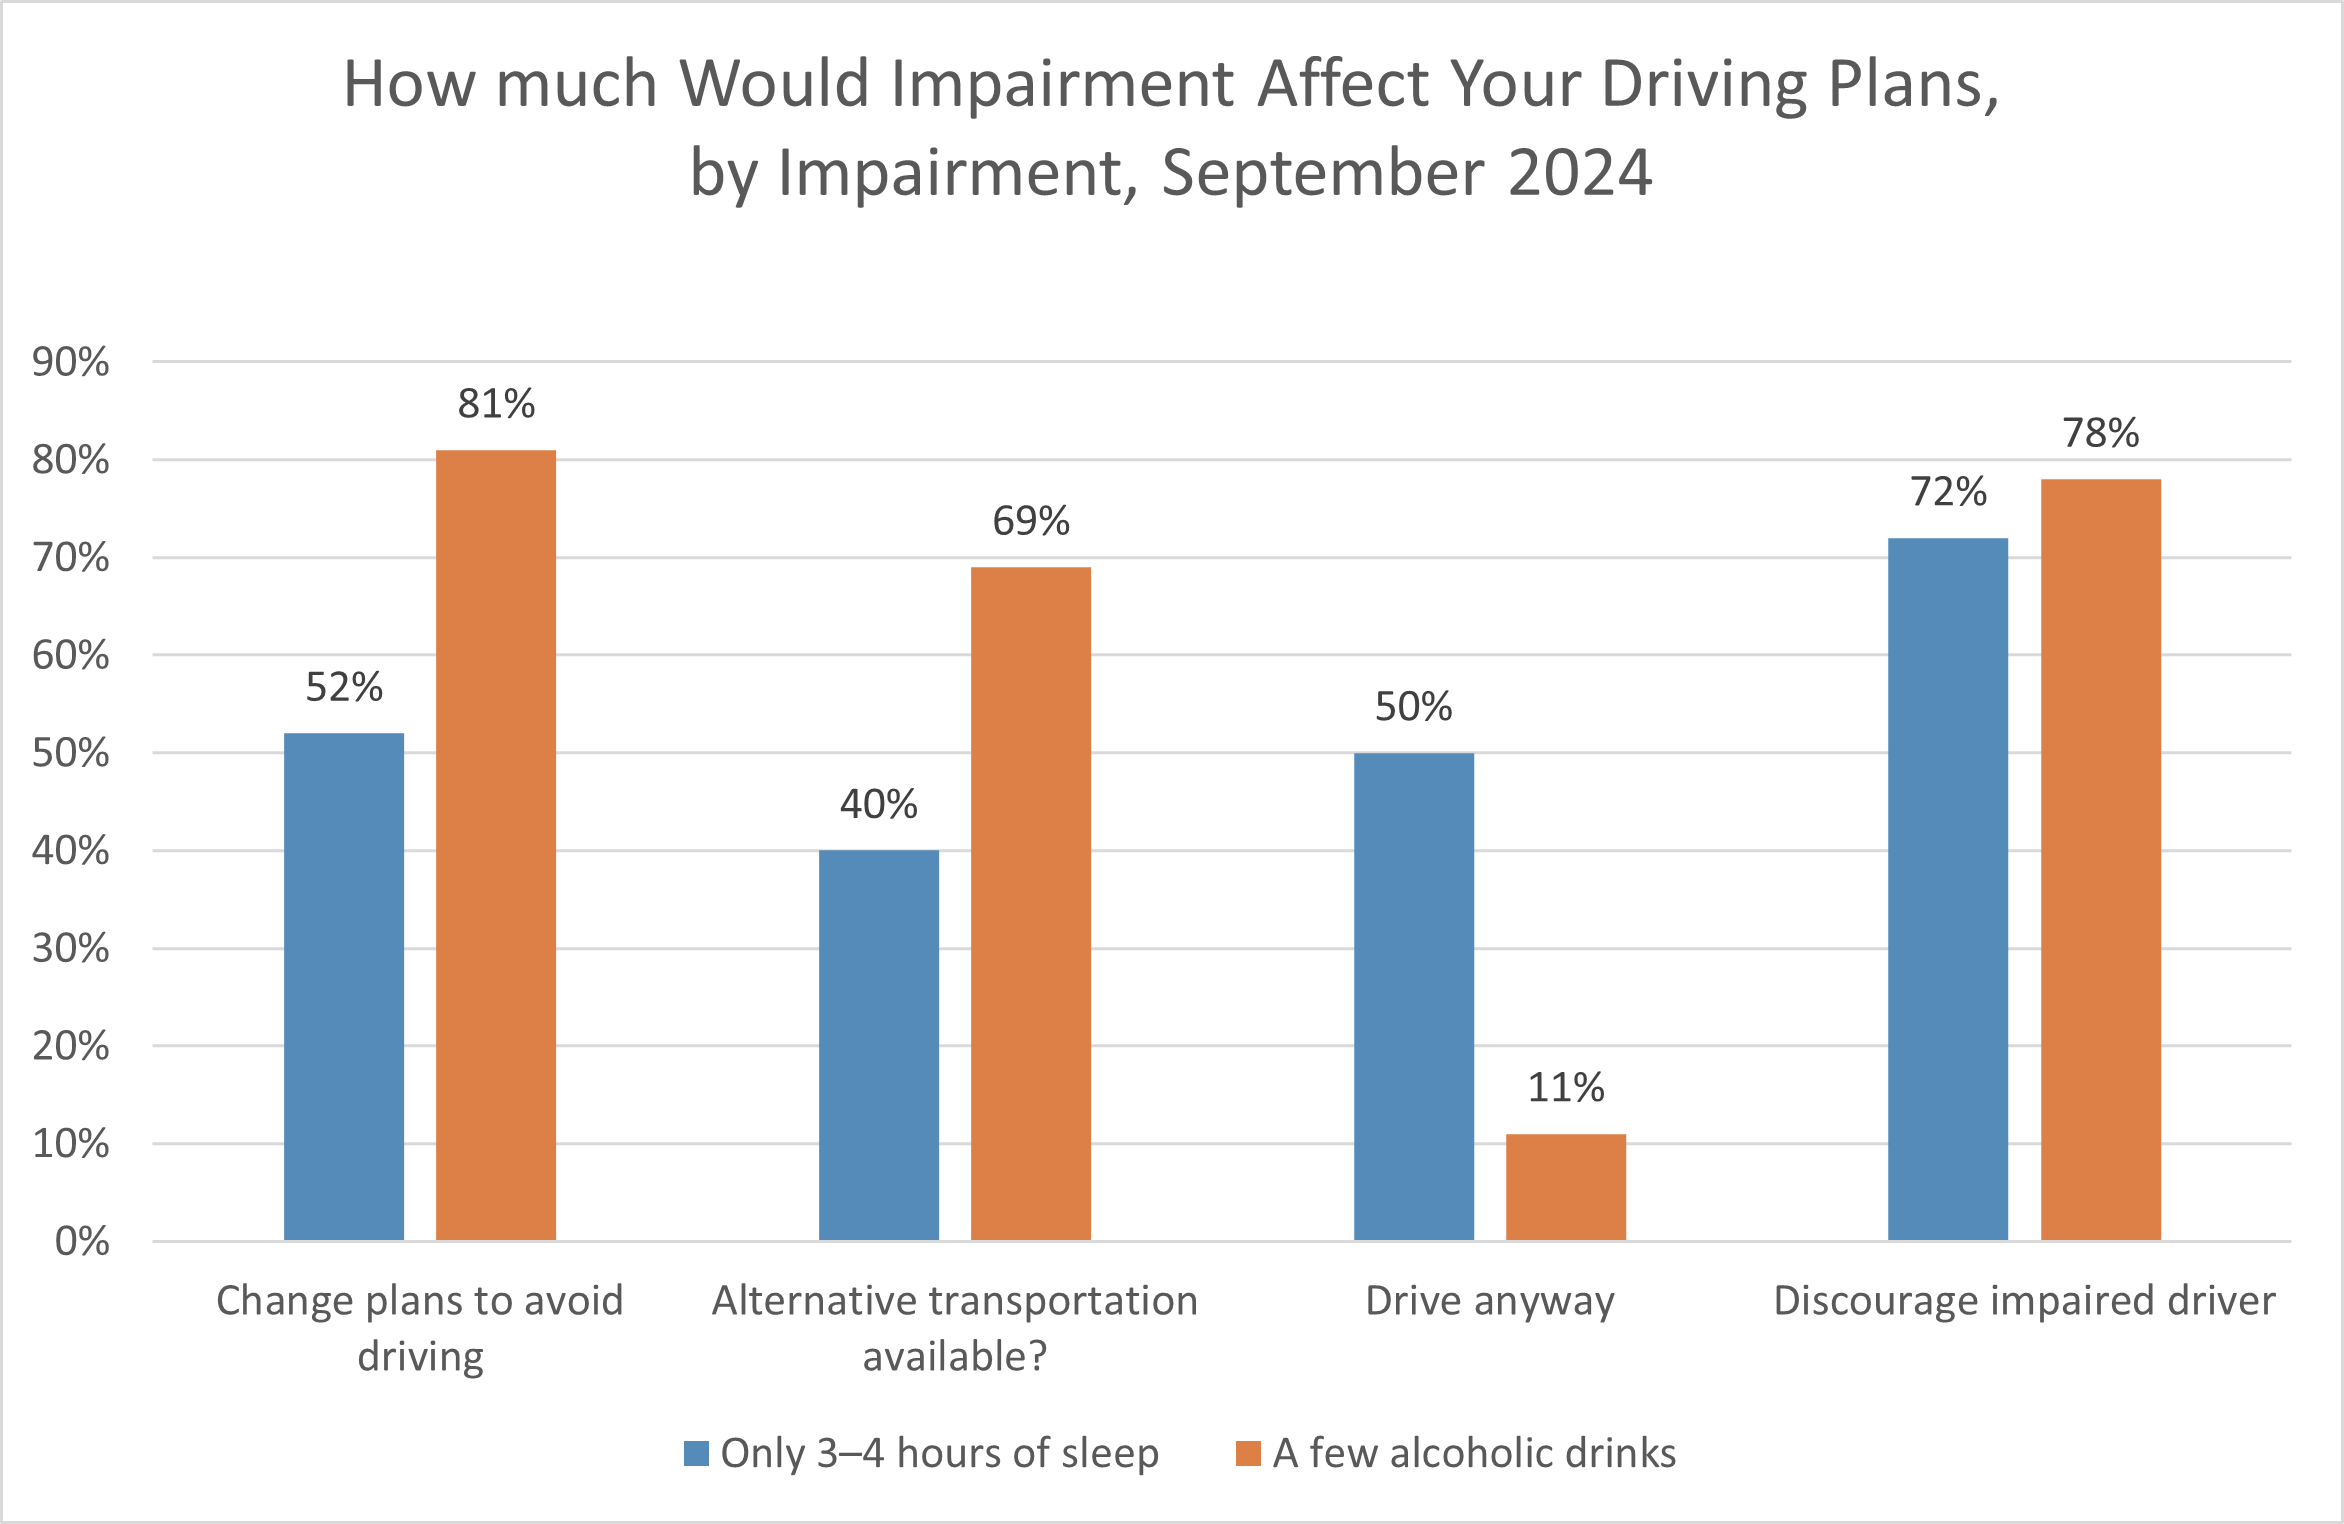
- If a driver falls asleep for just four seconds while traveling at a speed of 100 km/h (62 mph), the vehicle will travel 111 meters (364 feet) without a driver in control. (The length of a US football field, including the two end zones, is 109.7 meters or 360 feet.) (Transport Accident Commission, 2018)
- A survey of US drivers in 2023 found that 96.0% of them viewed drowsy driving as very or extremely dangerous. Nevertheless, 19.5% of them admitted that they had driven at least once in the past 30 days while being so tired that they had a hard time keeping their eyes open. (AAA Foundation for Traffic Safety, December 2024)
- In a 2005 survey of truck drivers in Pennsylvania, 19% of truck drivers reported falling asleep at the wheel at least once in the past month. In a similar 200 survey in Oregon, 21% reported falling asleep at the wheel at least once in the past month. (IIHS, August 2024)
- In a 2012 survey of truck drivers, about 14% reported having experienced a near-crash caused by drowsiness. (National Sleep Foundation, 2012)
- As of March 2023, only Arkansas and New Jersey have laws specifically against drowsy driving. In both states, there are heavy penalties for causing a fatal accident as the result of going without sleep for at least 24 hours. (Governors Highway Safety Association, March 2023)
Teen Accident Statistics
- In 2022, drivers aged 15–20 constituted 5.0% of all licensed drivers but 8.1% of drivers involved in fatal traffic crashes. (NHTSA, July 2024)
- In 2022, 2,034 drivers aged 15–20 were killed in traffic crashes, and 180,353 were injured. (NHTSA, July 2024)
- In 2022, the top three causes of death in persons ages 15–19 were homicide (2,781 deaths), motor vehicle crashes (2,620), and suicide (2,164). (National Center for Injury Prevention and Control, 2024)
- For drivers ages 16–17 from April 2016 to March 2017, the fatal crash rate per mile driven was about triple the rate for drivers ages 25–34. For drivers ages 16–19, the crash rate per mile driven was nearly four times the rate for drivers in their thirties. Per mile driven, the fatal crash rate of 16-year-old drivers was about 50% higher than that of drivers aged 18–19. See the following chart. (IIHS, August 2024)
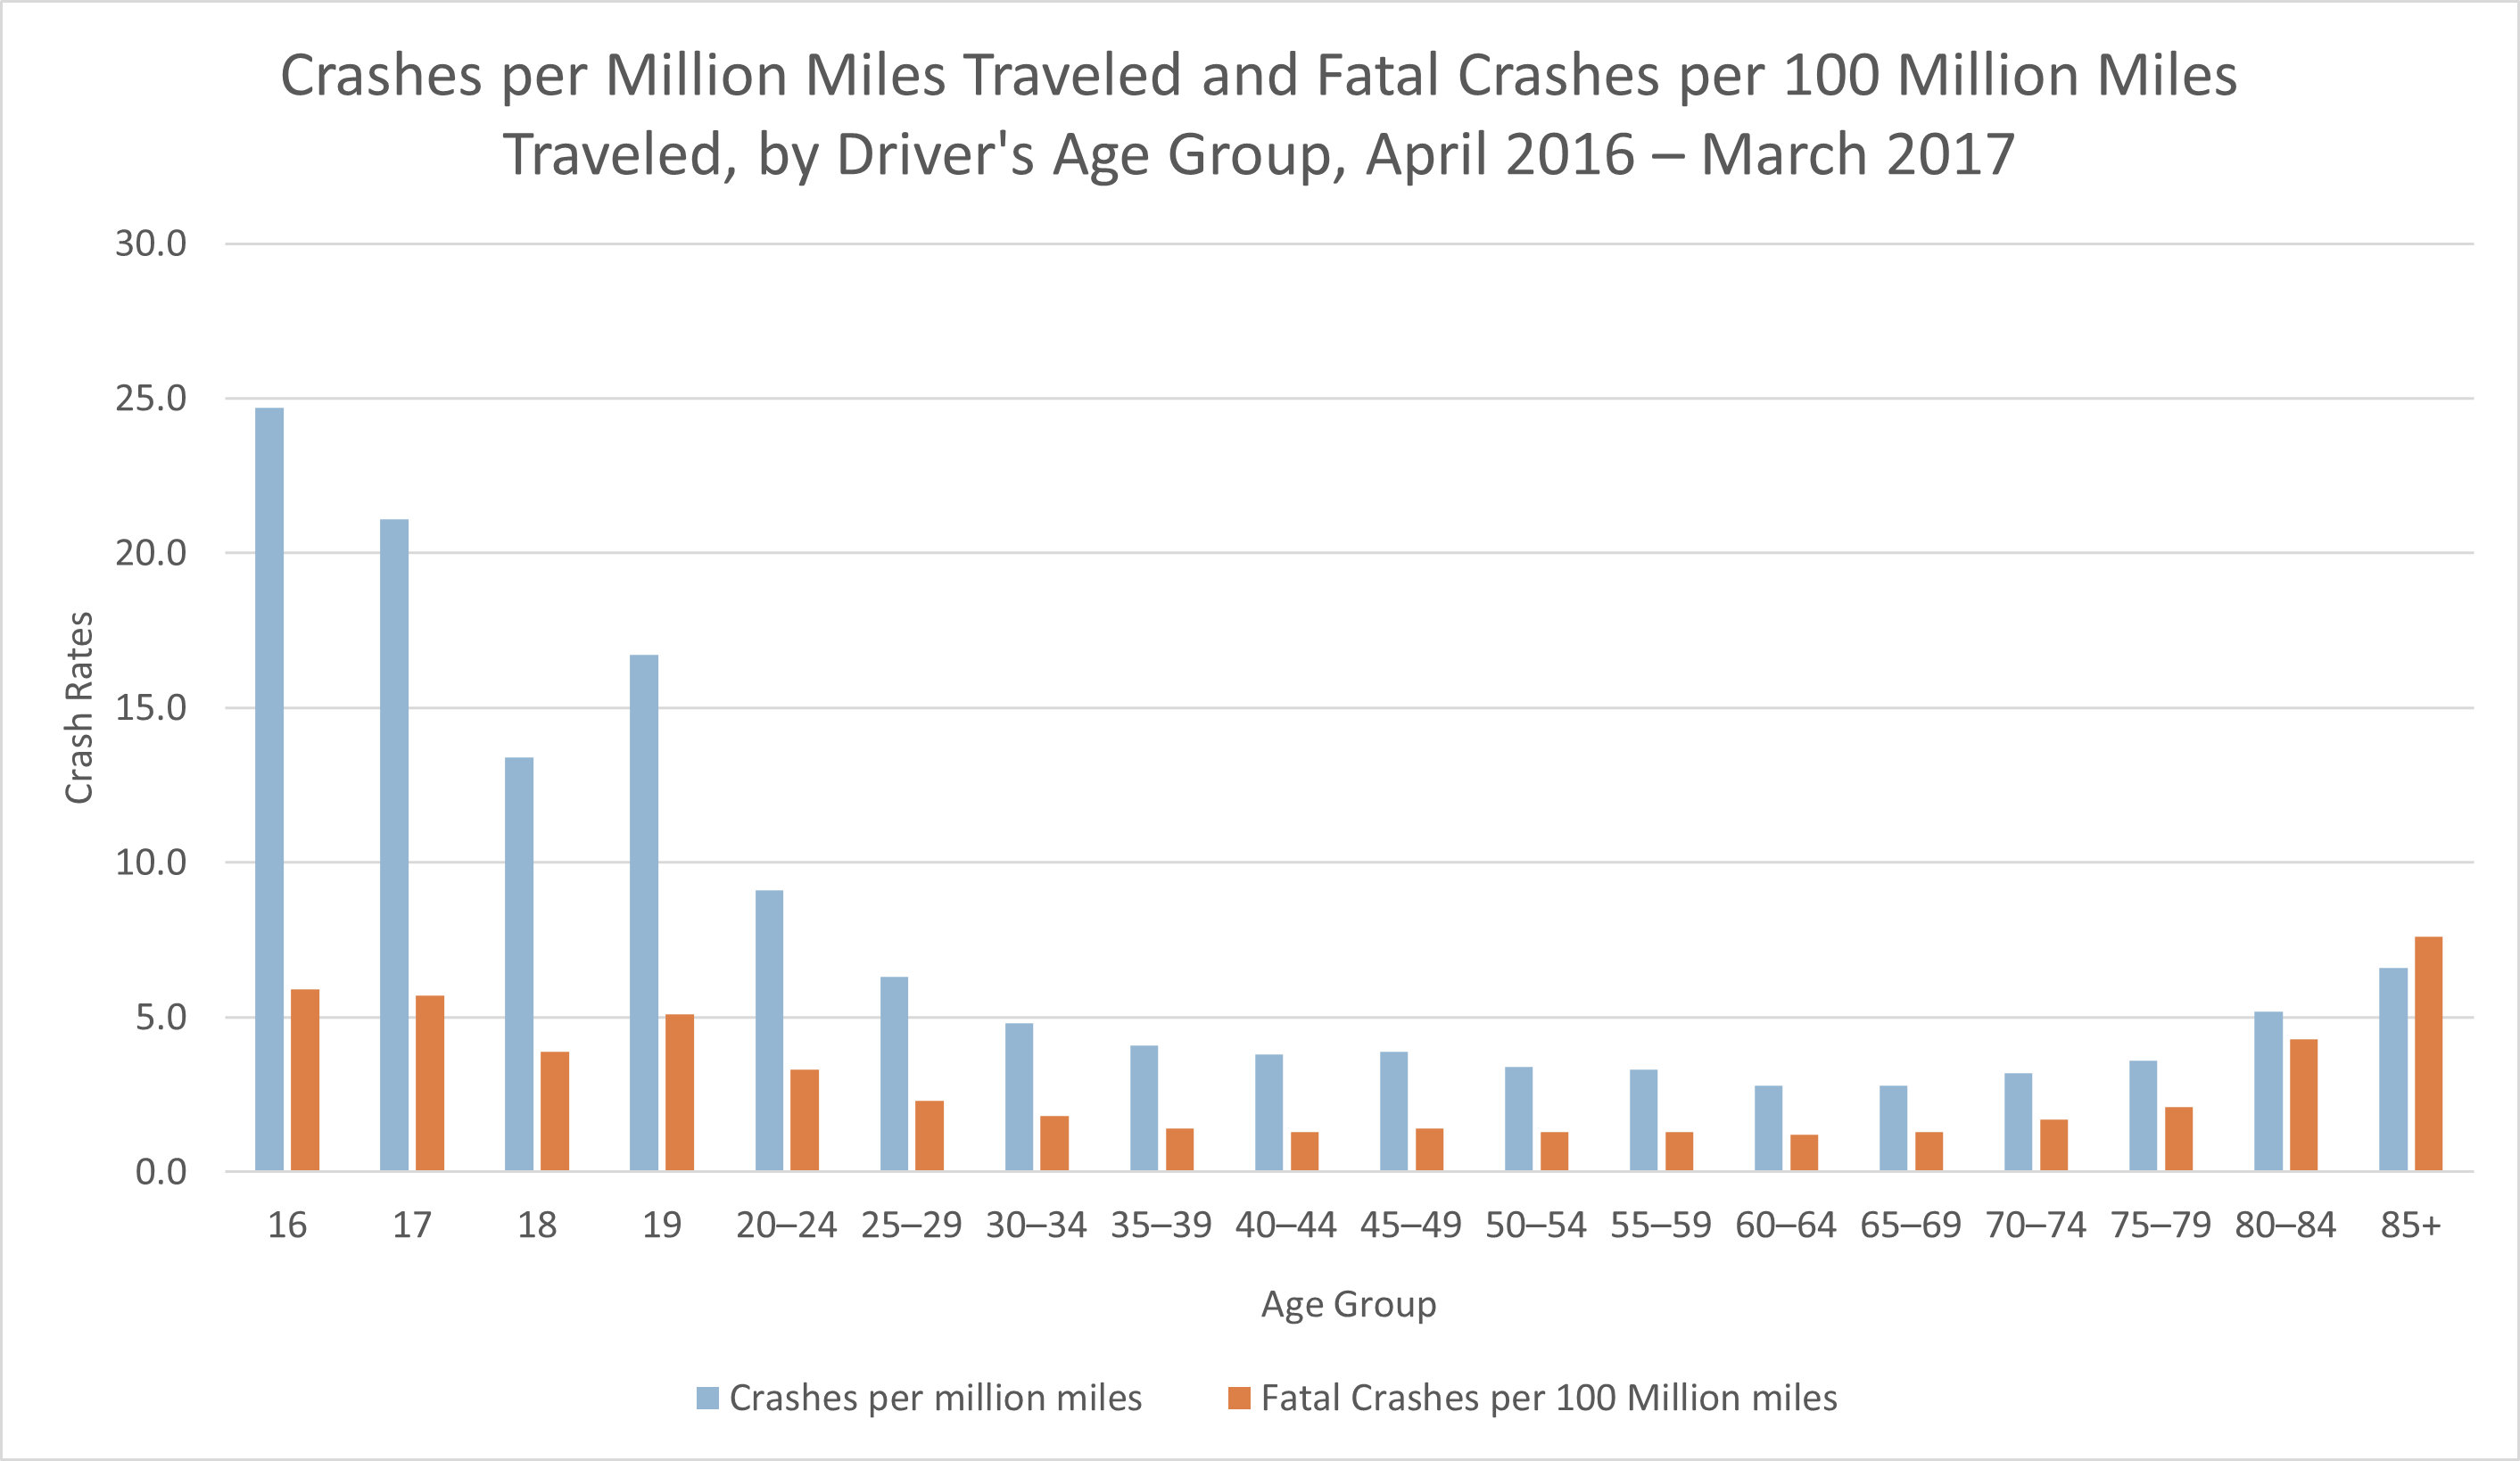
- From April 2016 to March 2017, the fatal crash rate of drivers ages 16–19 at night was nearly four times as high as it was during the day, and nearly triple the nighttime fatal crash rate of drivers ages 30–59. (IIHS, August 2024)
- In all US states, it is illegal for anyone under 21 to drink alcohol. Yet of the 2,034 drivers aged 15–20 who died in traffic crashes in 2022, 506 (24.9%) had a blood alcohol concentration (BAC) of 0.08% or higher. (0.08% is the threshold for legal intoxication except in Utah, where it is 0.05%.) (NHTSA, July 2024)
- A naturalistic driving study comparing 90 new adolescent drivers with 131 experienced adult drivers found that the adolescent drivers’ crash/near-crash rate per mile driven (CNC) was moderately (67%) higher during their supervised learner period. However, their CNC rate was dramatically higher (by a factor of 6.51) during their first year of licensure when they were driving unsupervised. (National Institutes of Health, 2018)
- Among drivers ages 15–20 who were involved in fatal crashes in 2022, 35% of males and 19% of females had been speeding at the time, more than any other age group for their respective genders. (NHTSA, July 2024)
- In 2022, 51% of motor vehicle crash deaths among teenagers occurred on Friday, Saturday, or Sunday. Motor vehicle crash deaths among teenagers occurred most often between 9 p.m. and midnight (20% of total teen crash deaths) and between 6 p.m. and 9 p.m. (16% of total teen deaths) than at other times. (IIHS, June 2024)
- A statistical analysis of passenger-vehicle crashes that had occurred in 2016–2019 found that a driver aged 16–17 was 60% more likely to die in the crash if there had been one teen passenger in the vehicle and twice as likely to die if there had been at least two teen passengers in the vehicle. On the other hand, a driver aged 16–17 was 60% less likely to die in the crash if there had been an adult (ages 35–64) passenger in the vehicle. (AAA Foundation for Traffic Safety, October 2021)
- A study of 16-year-old drivers during 1994–2004 concluded that state graduated driver licensing (GDL) programs reduced the risk of a fatal crash by about 11%, compared with jurisdictions that did not have such programs. For GDL programs that included age requirements plus three or more months of waiting before proceeding from the learner to the intermediate stage, nighttime driving restrictions, and either restrictions on carrying passengers or supervised driving of at least 30 hours, the risk of a fatal crash was reduced by 16–21%. (NHTSA, June 2006)
Senior Accident Statistics
- In 2022, there were 51,523,603 licensed drivers ages 65 and older (21.9% of all licensed drivers). This total consisted of 24,588,981 male drivers ages 65 and older (21.2% of all male drivers) and 26,934,622 female drivers ages 65 and older (22.8% of all female drivers.) (Federal Highway Administration, April 2024)
- In 2022, drivers aged 65 and older made up 14% of drivers involved in fatal traffic crashes. (NHTSA, August 2024)
- In 2022, 7,971 people ages 65 and older were killed in traffic crashes, representing 19% of all traffic fatalities. This is the highest number of traffic fatalities in this age group ever recorded for a single year. (NHTSA, August 2024)
- Among senior drivers in 2022, those aged 85 and older had the highest traffic fatality rate per 100,000 population. (NHTSA, August 2024) Also see the previous section Fatalities by age.
- In every year from 2013 to 2022, the traffic fatality rate per 100,000 population of drivers ages 65 and older was higher than the rate for younger drivers. However, in that period, the traffic fatality rate per 100,000 population of drivers ages 65 and older increased from 12.81 in 2013 to 13.79 in 2022, an increase of 0.98. In this same period, the traffic fatality rate of the population under 65 increased from 9.99 in 2013 to 12.47 in 2022, an increase of 2.48. Thus, recent years have seen a narrowing of the difference in fatality rates between older and younger drivers. See the following chart. (NHTSA, August 2024)
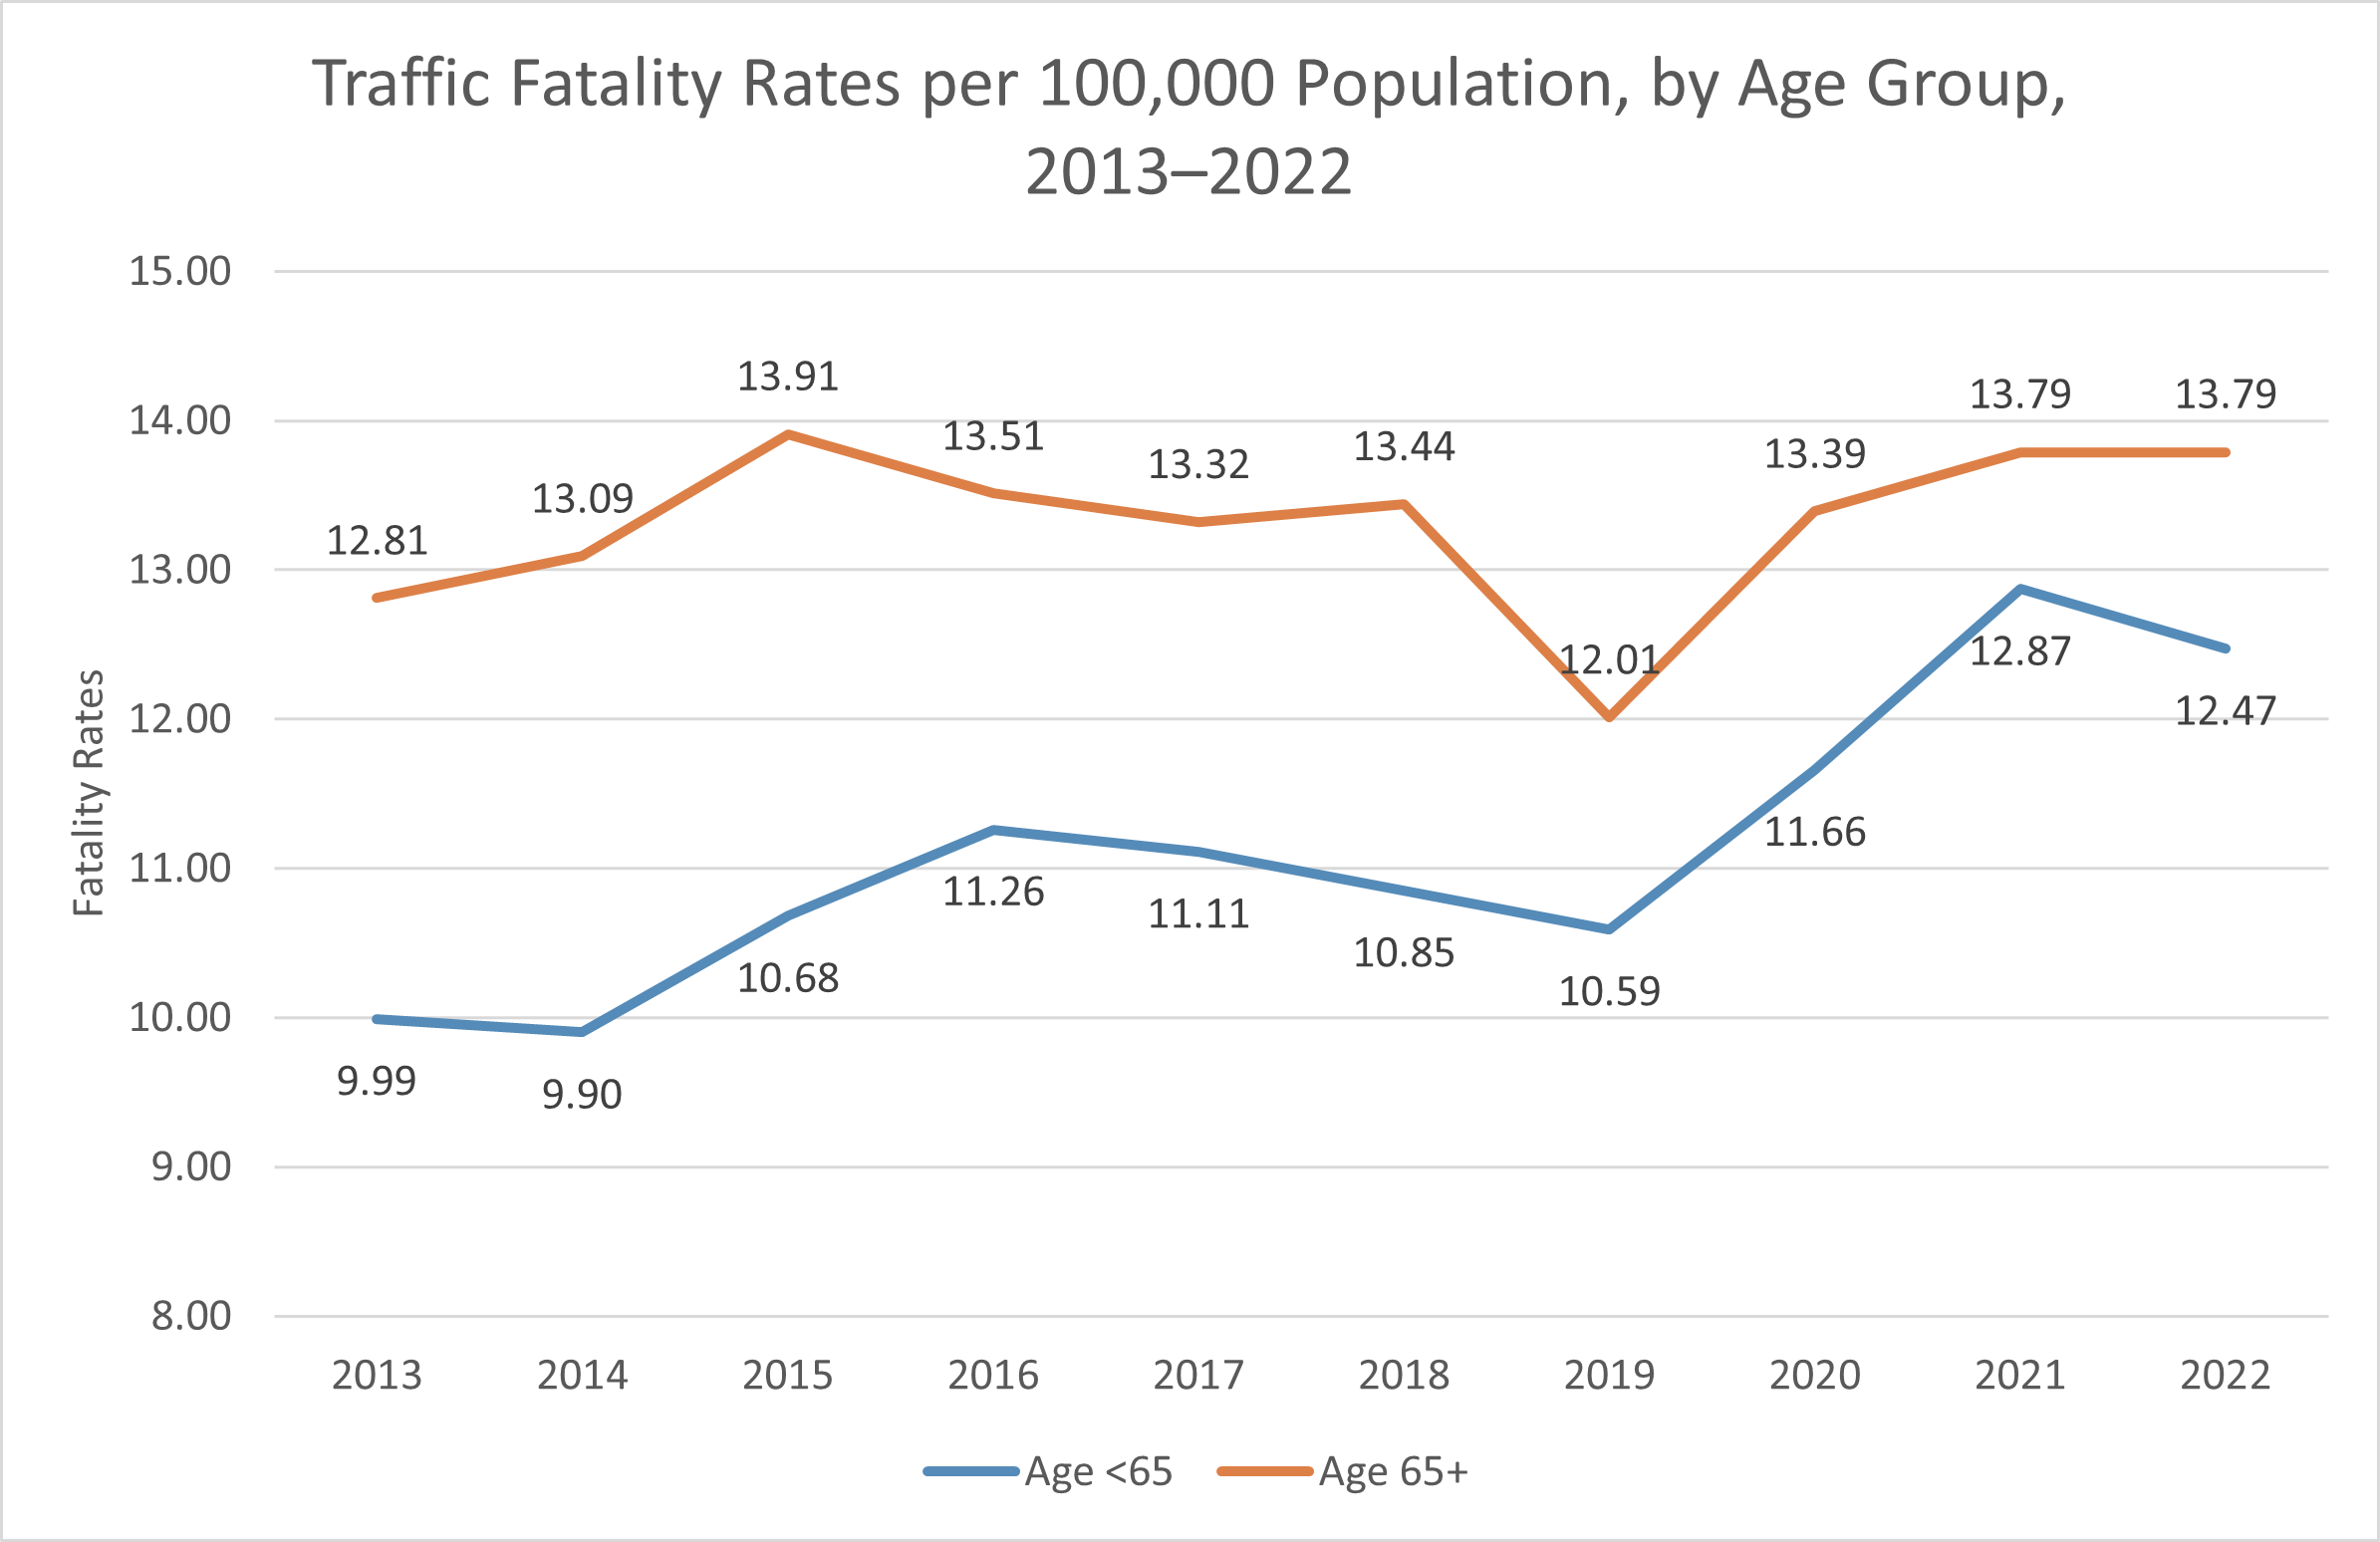
- Among drivers ages 65 and older in 2022, most traffic fatalities occurred in the daytime (72%), on weekdays (70%), and in multi-vehicle crashes (67%). The corresponding percentages for the general driving population were lower: 46%, 58%, and 46% respectively. (NHTSA, August 2024)
- One factor increasing the crash fatality rate for senior drivers is their relative fragility, resulting in high vulnerability to serious injury in crashes. The rate of driver deaths per 1,000 drivers in crashes starts increasing for drivers aged 50–54 and rises sharply starting around age 70. See the following chart. (IIHS, July 2024)
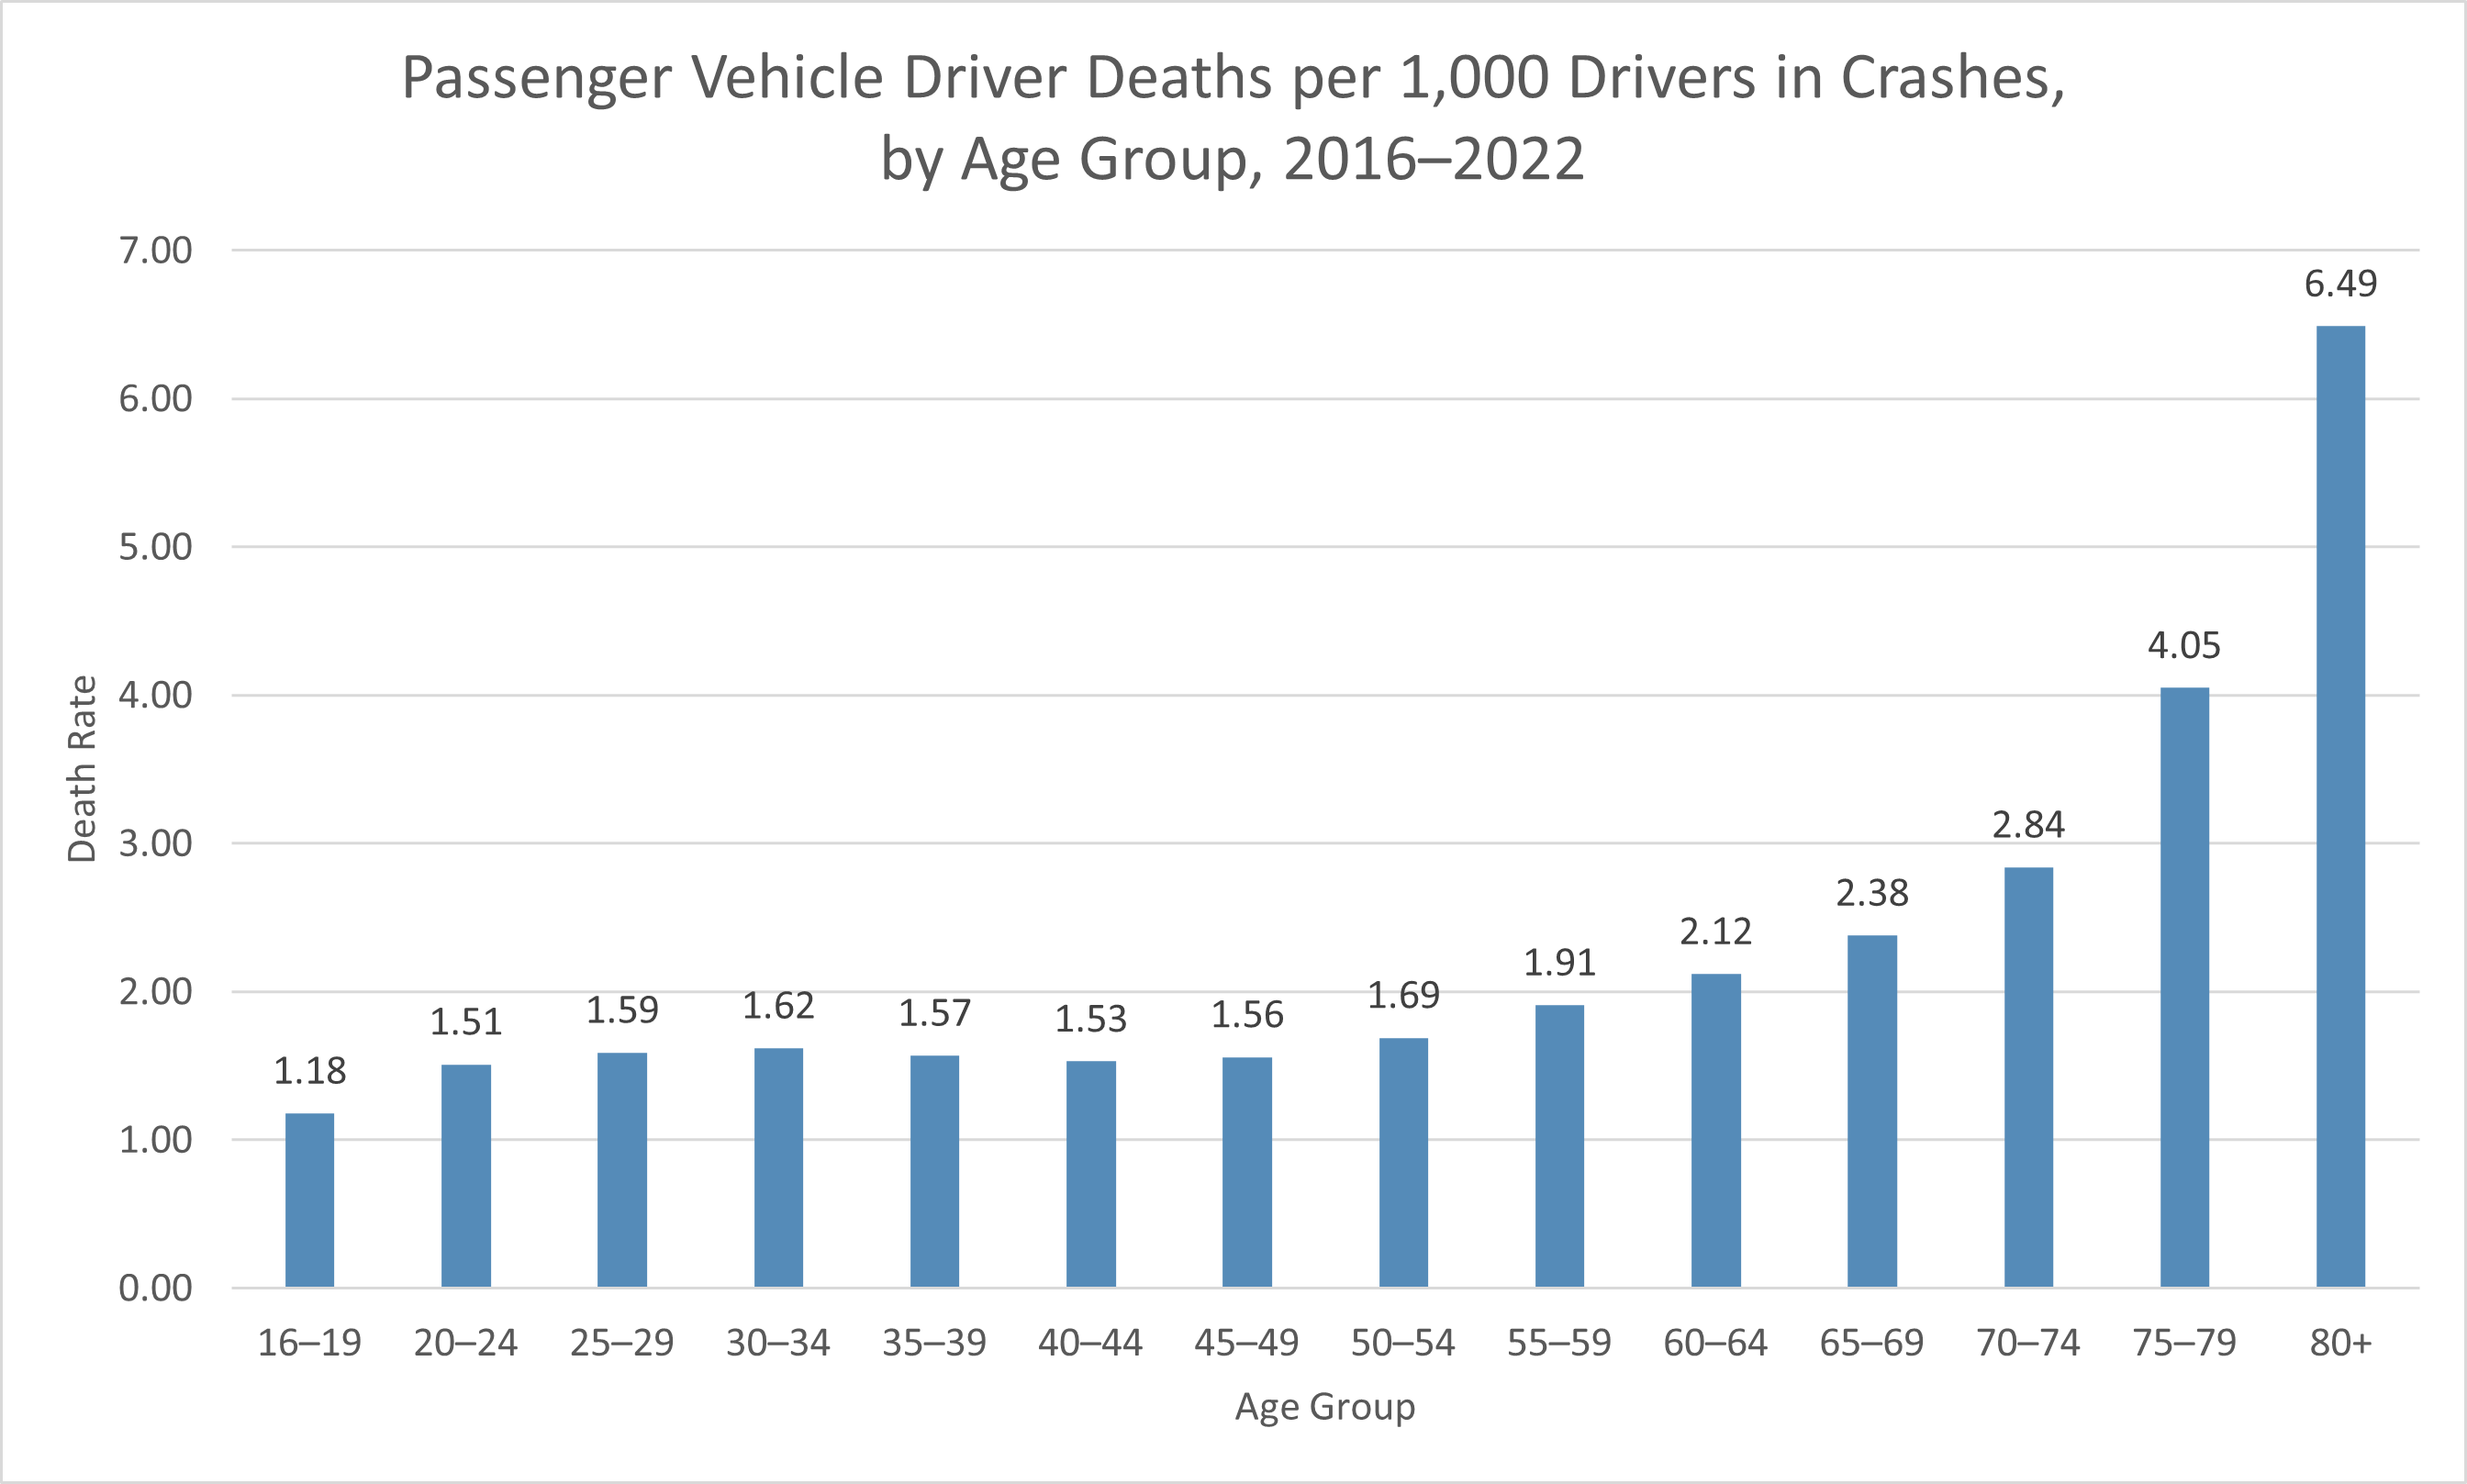
- In 2022, the rate of fatalities per capita among people ages 70 and older was 45% lower than in 1975. (IIHS, July 2024)
- Of persons ages 70 and older who were killed in traffic crashes in 2022, 71% were passenger vehicle occupants, 18% were pedestrians, and 6% were motorcyclists. These proportions have significantly shifted in recent decades. Among older persons killed in 1975, 61% were passenger vehicle occupants, 36% were pedestrians, and 6% were motorcyclists. The number of older motorcyclists killed rose sharply from 5 in 1975 to 310 in 2022. (IIHS, July 2024)
- Unlike younger passenger vehicle drivers, drivers ages 70 and older can present more of a danger to themselves than to others. Among passenger vehicle drivers ages 70 and older who were involved in crashes in 2022, most (58.5%) of the deaths were the senior drivers themselves; only 11.7% of the deaths were occupants of other vehicles involved in the crash. In contrast, among drivers under 30, fewer (37.3%) of the deaths were the younger drivers themselves, and 22.5% were occupants of other vehicles – twice as large a percentage as for the senior drivers. See the following chart. “Vulnerable road users” include pedestrians, bicyclists, and motorcyclists. (Note: the height of each bar doesn’t quite equal 100.0% because a tiny percentage of deaths marked “other/unknown” is not shown.) (IIHS, July 2024)
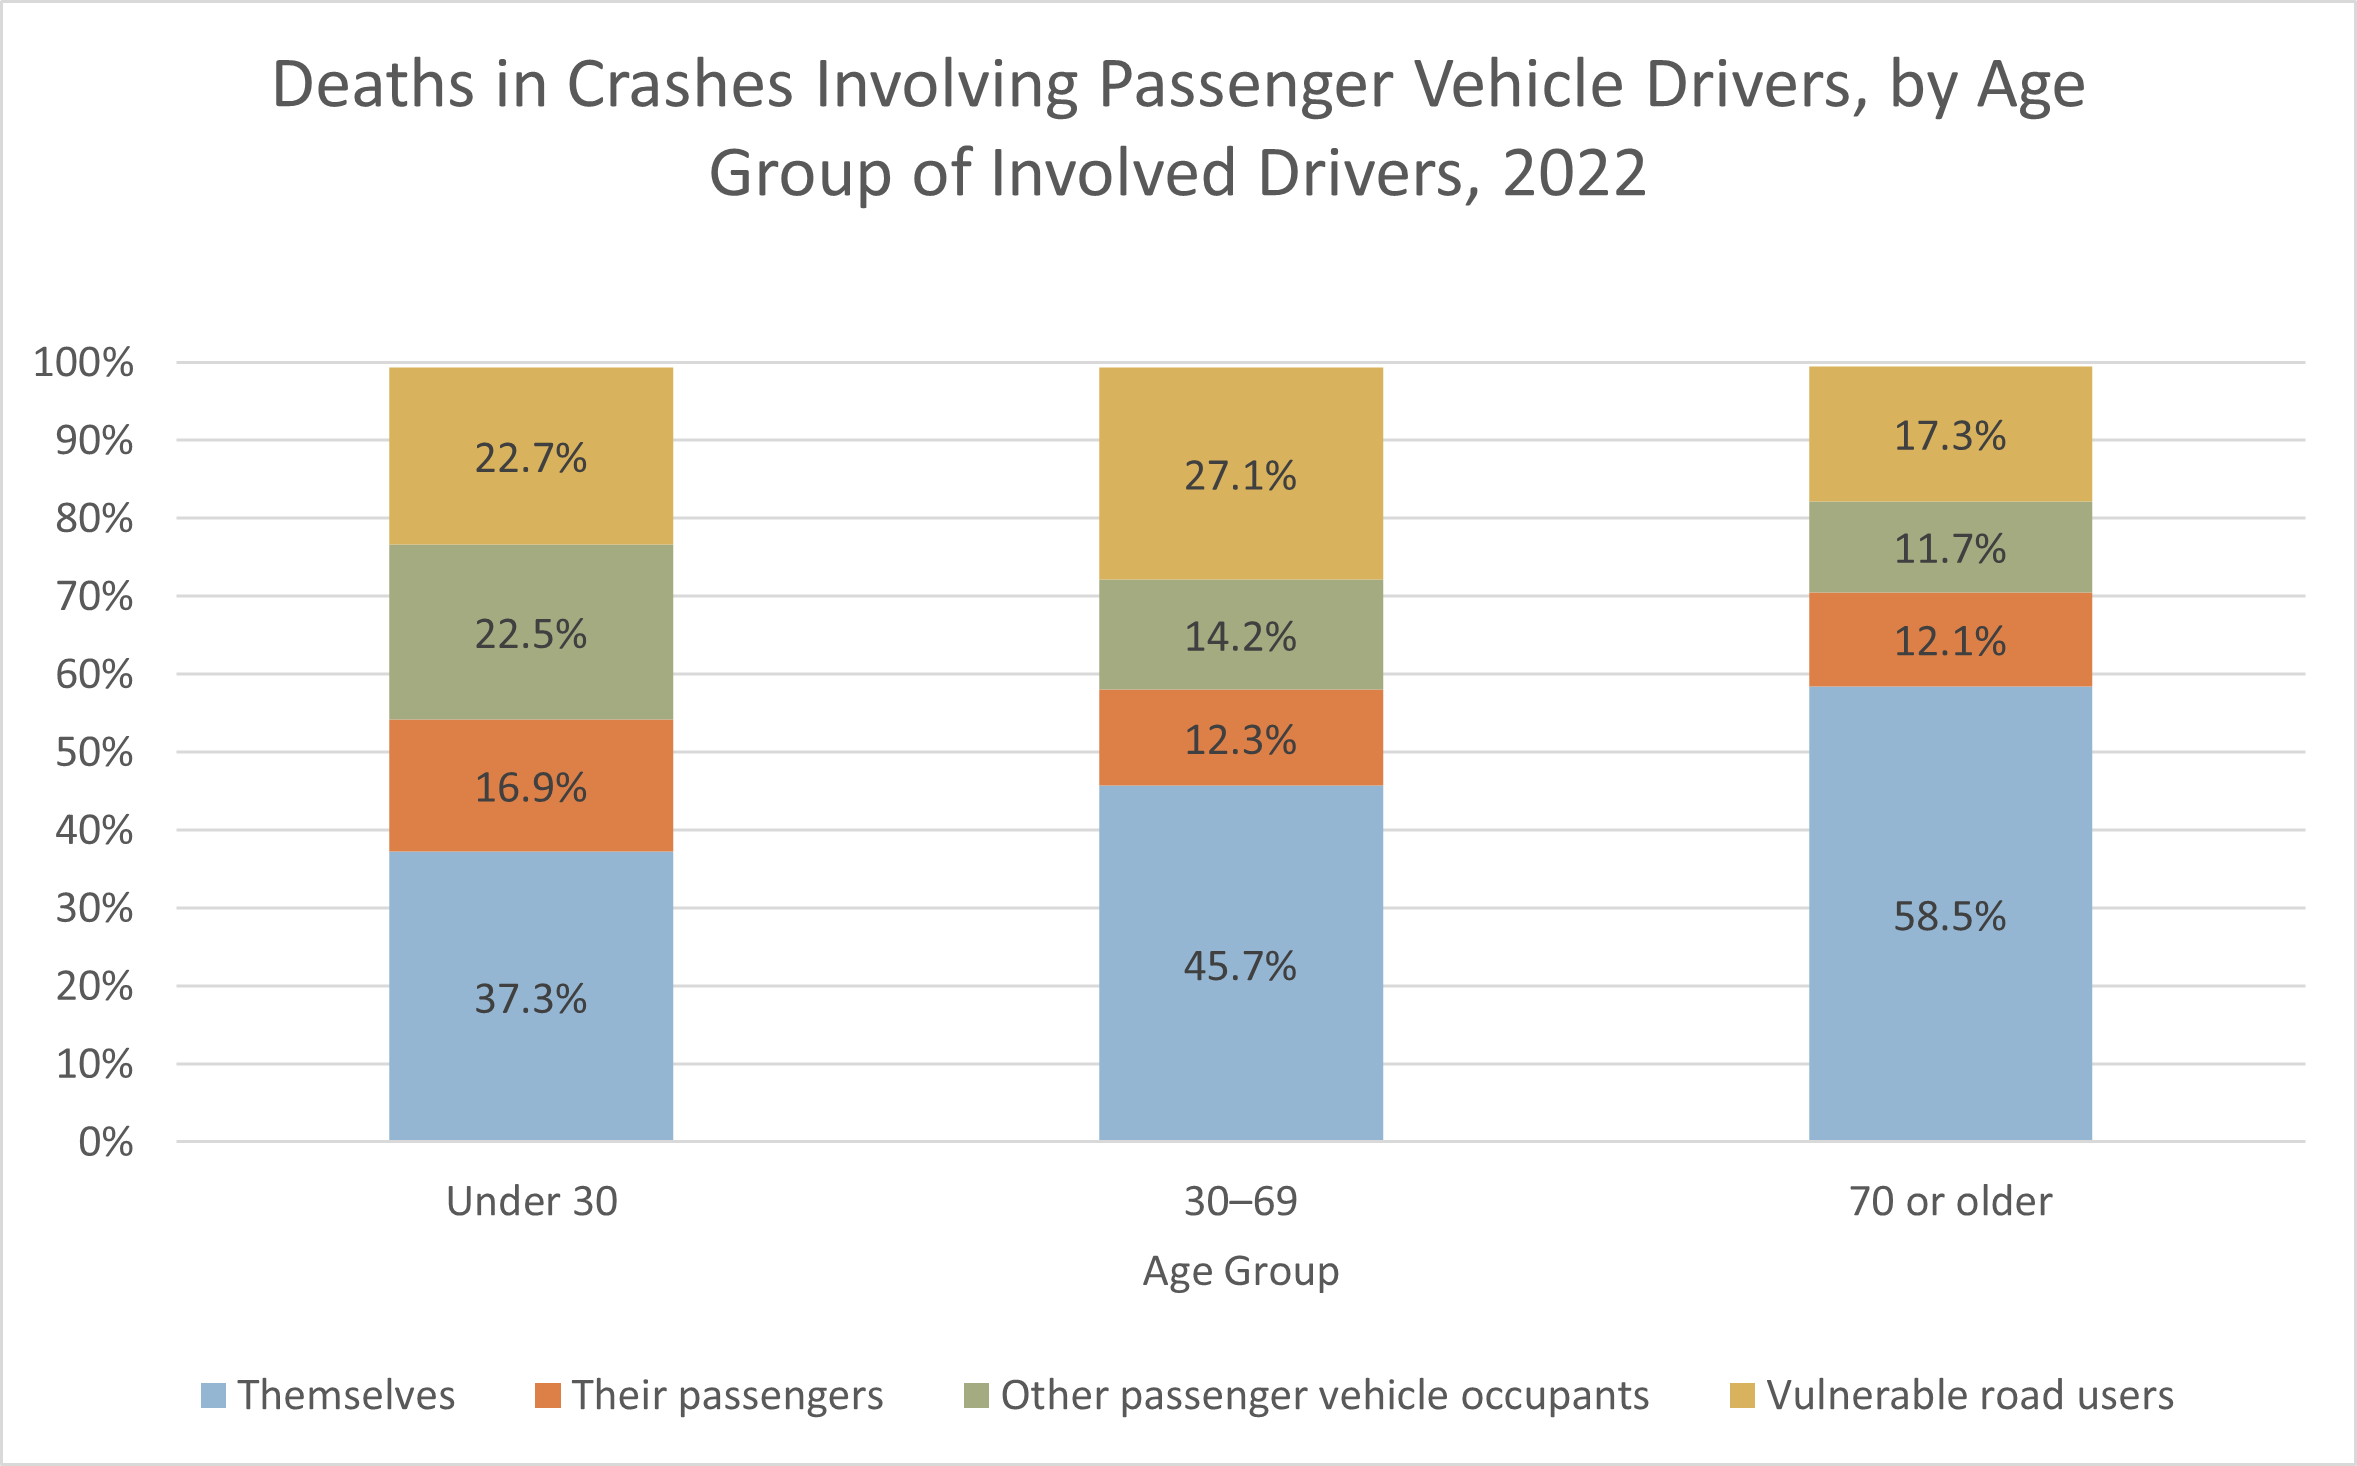
- In 2022, drivers aged 65 and older represented 22% of all licensed drivers and accounted for 14% of drivers involved in fatal traffic crashes. (NHTSA, August 2024)
- From 2013 through 2022, the population of Americans aged 65 and older increased by 29.5%. In this same period, traffic fatalities in this age group increased by 39.5%, including an increase of 49.6% for older male drivers and an increase of 21.8% for older female drivers. (NHTSA, August 2024)
- Among passenger vehicle occupants killed in crashes in 2022 for whom seatbelt use was known, 69% of those aged 65 and older were restrained, compared with 45% of those under age 65. (NHTSA, August 2024)
- Drivers aged 70 or older have the second-highest crash death rate per mile driven (after drivers aged 16–19), even though they drive fewer miles than younger drivers. (IIHS, July 2024)
- As of May 2024, 37 states and Washington, DC have imposed special requirements on senior drivers, although these requirements vary among states. These requirements usually take the form of more frequent license renewals, prohibitions on online renewals (i.e., in-person renewals only), and more frequent vision tests. A few states require a mandatory road test. For example, Illinois requires a driver to pass a road test upon turning 75. No state currently requires a mandatory knowledge test, but some states can require it of a driver whose license has expired or who shows signs of cognitive impairment. (IIHS, April 2025)
- A study of licensing and renewal requirements for older drivers, based on data from 46 states from 1985 to 2011, found that requiring in-person license renewal resulted in a significant 9% reduction in the fatal crash involvement rate for drivers ages 55 and older, and a significant 25% reduction for drivers ages 85 and older. Requiring a vision test at license renewal did not produce a significant reduction in fatal crash involvement rates. There was insufficient data to analyze the effect of mandatory road testing, because only three states had such a requirement at the time. (AAA Foundation for Traffic Safety, July 2014)
Trucking Statistics
- Of the 282,354,993 registered vehicles in the United States in 2021, 10,715,697 were single-unit trucks (straight trucks), 3,143,484 were combination trucks (semi-trucks and tractor-trailers), and 939,219 were buses. There were 3,132.4 billion vehicle miles traveled (VMT) by all motor vehicles. Large trucks traveled 327.0 billion of those miles (10.4% of the total), and buses traveled 16.7 billion of those miles (0.5% of the total). (FMCSA, December 2023)
- In 2021, there were 893,491 interstate freight carriers (up 22.4% from 2018), 14,149 interstate passenger carriers (down 16.4% from 2018), and 127,165 intrastate hazardous materials carriers (up 12.9% from 2018). (FMCSA, December 2023)
- In 2022, heavy trucks (single-unit and combination) traveled a total of 331.27 billion miles. Combination trucks (semi-trucks and tractor-trailers) alone traveled 195.05 billion miles. (American Trucking Associations, January 2024)
- In 2023, there were about 8.5 million people employed in trucking-related jobs (not counting the self-employed). This included 3.55 million truck drivers. (American Trucking Associations, accessed March 2025)
- In 2021, the percentage of weight of freight moved by truck significantly exceeded the weight moved by all other freight transportation modes combined. See the following chart. (Note: air transportation accounted for just 0.01% of total freight weight and therefore does not show up on this chart. (FMCSA, December 2023)
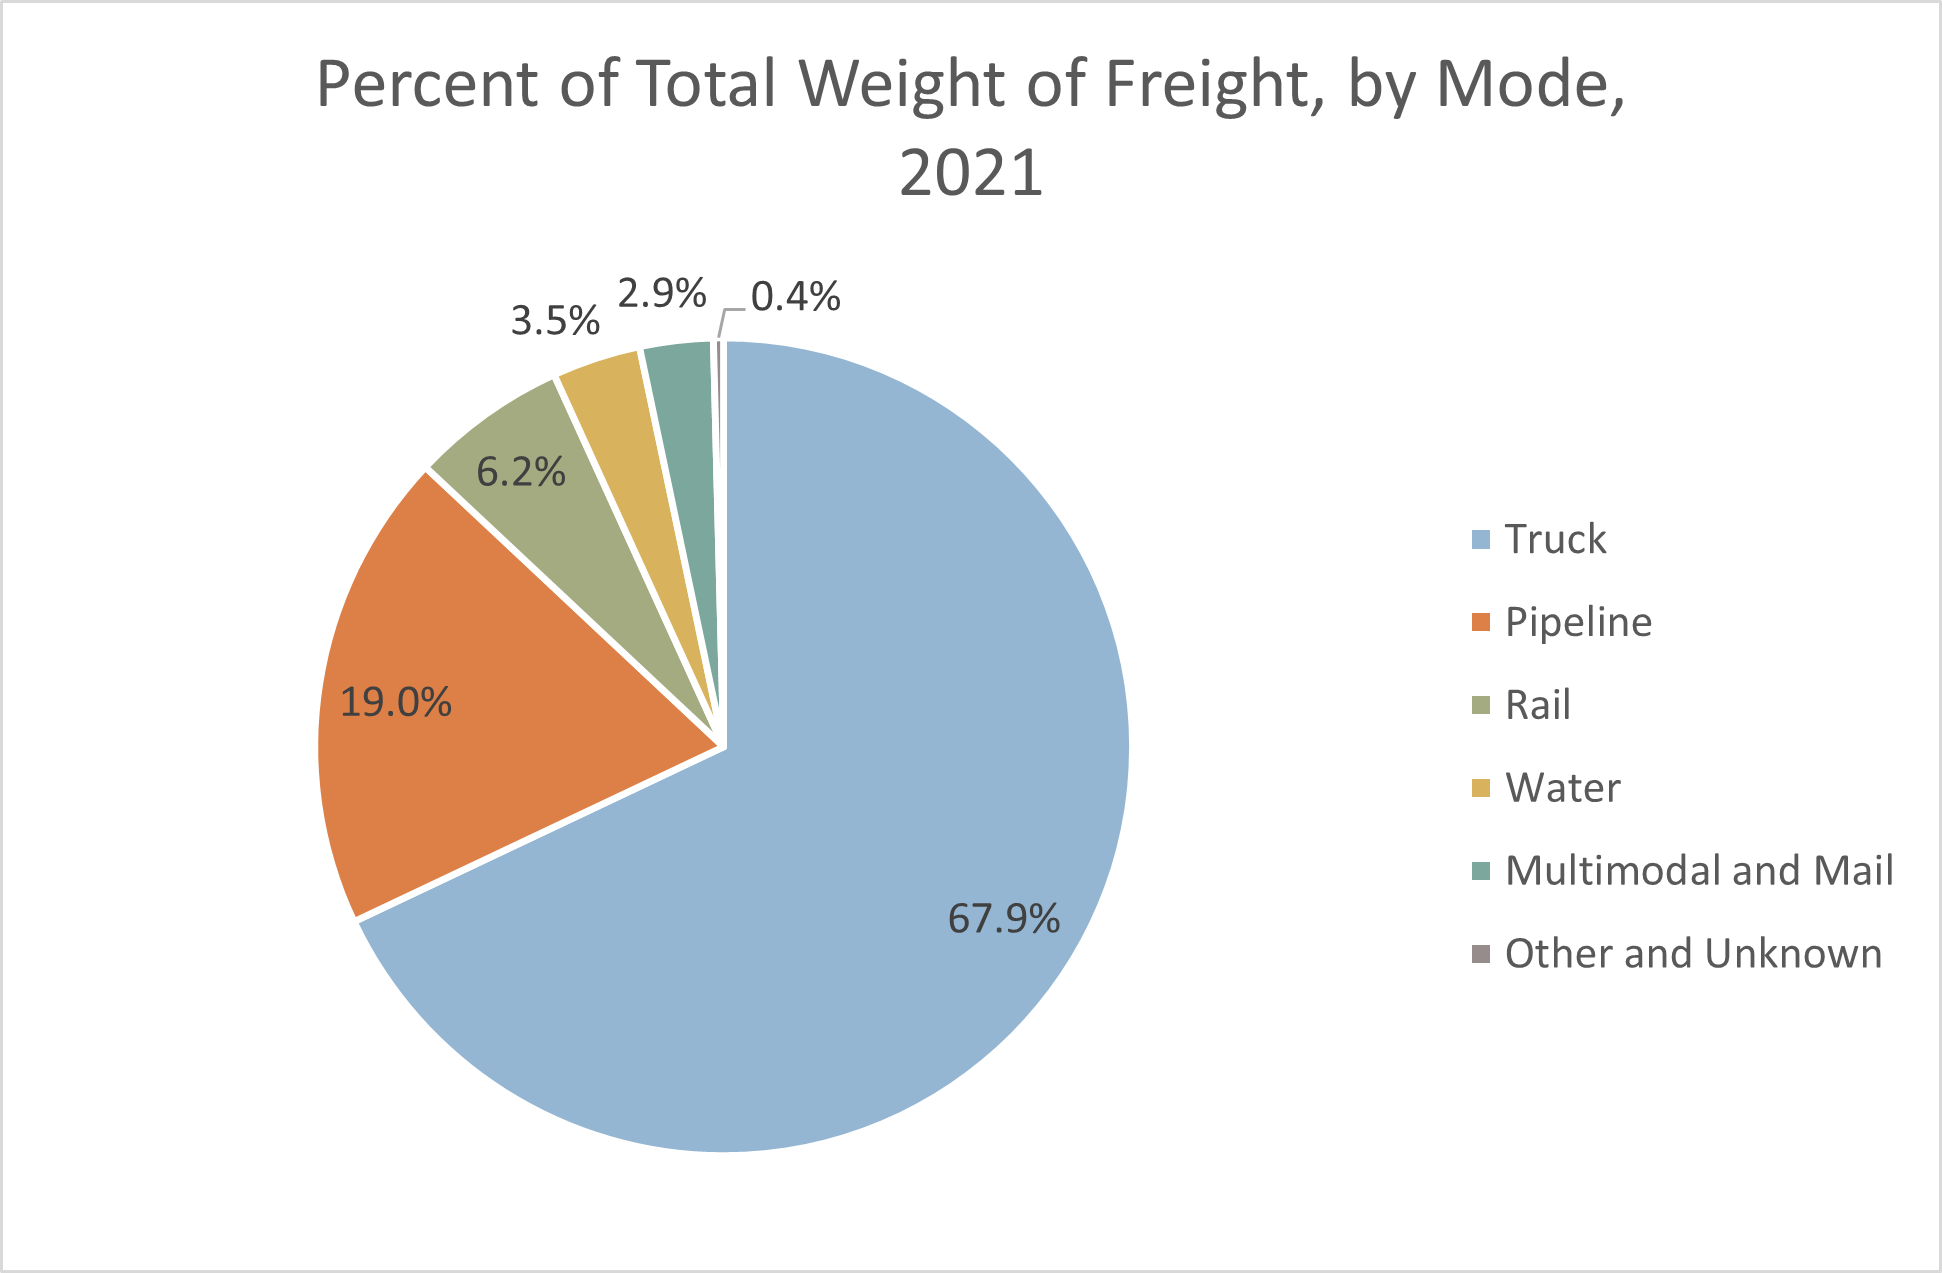
- In 2023, the U.S. freight transportation system moved 20.1 billion tons of goods valued at about $18.7 trillion. Trucks transported 64.5% of the tonnage and 72.5% of the total value. (Bureau of Transportation Statistics, 2024)
- In 2023, domestic truck tonnage totaled 11.18 billion tons of freight. Trucks transported 66.5% of the value of surface trade between the U.S. and Canada and 84.5% of the value of surface trade between the U.S. and Mexico. (American Trucking Associations, accessed March 2025)
- 80% of US communities rely exclusively on trucks to receive their goods. (American Trucking Associations, January 2024)
- In 2021, large trucks (including both single-unit and combination vehicles) accounted for 5% of registered vehicles and 10% of vehicle miles traveled. (Federal Highway Administration, 2023)
- As of May 2024, the average annual wage for the drivers of large trucks (including tractor-trailers) was $58,400. The average annual wage for small-truck drivers was $47,950. See the following table. (Bureau of Labor Statistics, accessed April 2025)
|
|
Heavy Truck Drivers |
Light Truck Drivers |
|
Annual 10th percentile wage |
$38,640 |
$29,580 |
|
Annual 25th percentile wage |
$47,230 |
$36,670 |
|
Annual median wage |
$57,440 |
$44,140 |
|
Annual mean (average) wage |
$58,400 |
$47,950 |
|
Annual 75th percentile wage |
$65,520 |
$52,460 |
|
Annual 90th percentile wage |
$78,800 |
$79,630 |
- Certain kinds of specialized trucking jobs can pay significantly more than average. Here are some examples. (CloudTrucks, March 2024)
|
Trucking Job |
Average Annual Wage |
|
Specialty Vehicle Hauler |
$95,146 |
|
Oversized Load Driver |
$82,262 |
|
Ice Road Driver |
$66,422 |
|
Tanker Driver |
$62,166 |
|
Hazmat Driver |
$61,068 |
- As of April 2025, the average annual salary for dump truck drivers was $54,414, ranging from $38,416 (for entry-level drivers) to $77,074 (for 90th-percentile drivers). (Indeed, April 2025)
- Based on absolute numbers of fatalities in 2023, “Trucking and other transportation” remained the most dangerous occupation in the United States, with 1,495 fatal work injuries – more than any other major occupational group. However, based on the rate of fatalities per 100,000 full-time workers, the most dangerous occupational group was “Farming, fishing, and forestry,” with 24.2 fatal injuries per 100,000 full-time workers. “Trucking and other transportation” was in second place with 13.6 fatal injuries per 100,000 full-time workers. (Bureau of Labor Statistics, December 2024; Land Line, March/April 2025)
- From 2002 through 2023, the number of fatal work injuries among heavy truck and tractor-trailer drivers was not significantly reduced by changes to hours-of-service regulations in 2003 and 2013 or the ELD mandate in 2013. What did significantly reduce the number of fatalities was economic recessions, like those caused by the COVID19 pandemic of 2020 and especially the financial crisis of 2008. See the following chart. (Bureau of Labor Statistics, December 2024; Land Line, March/April 2025)
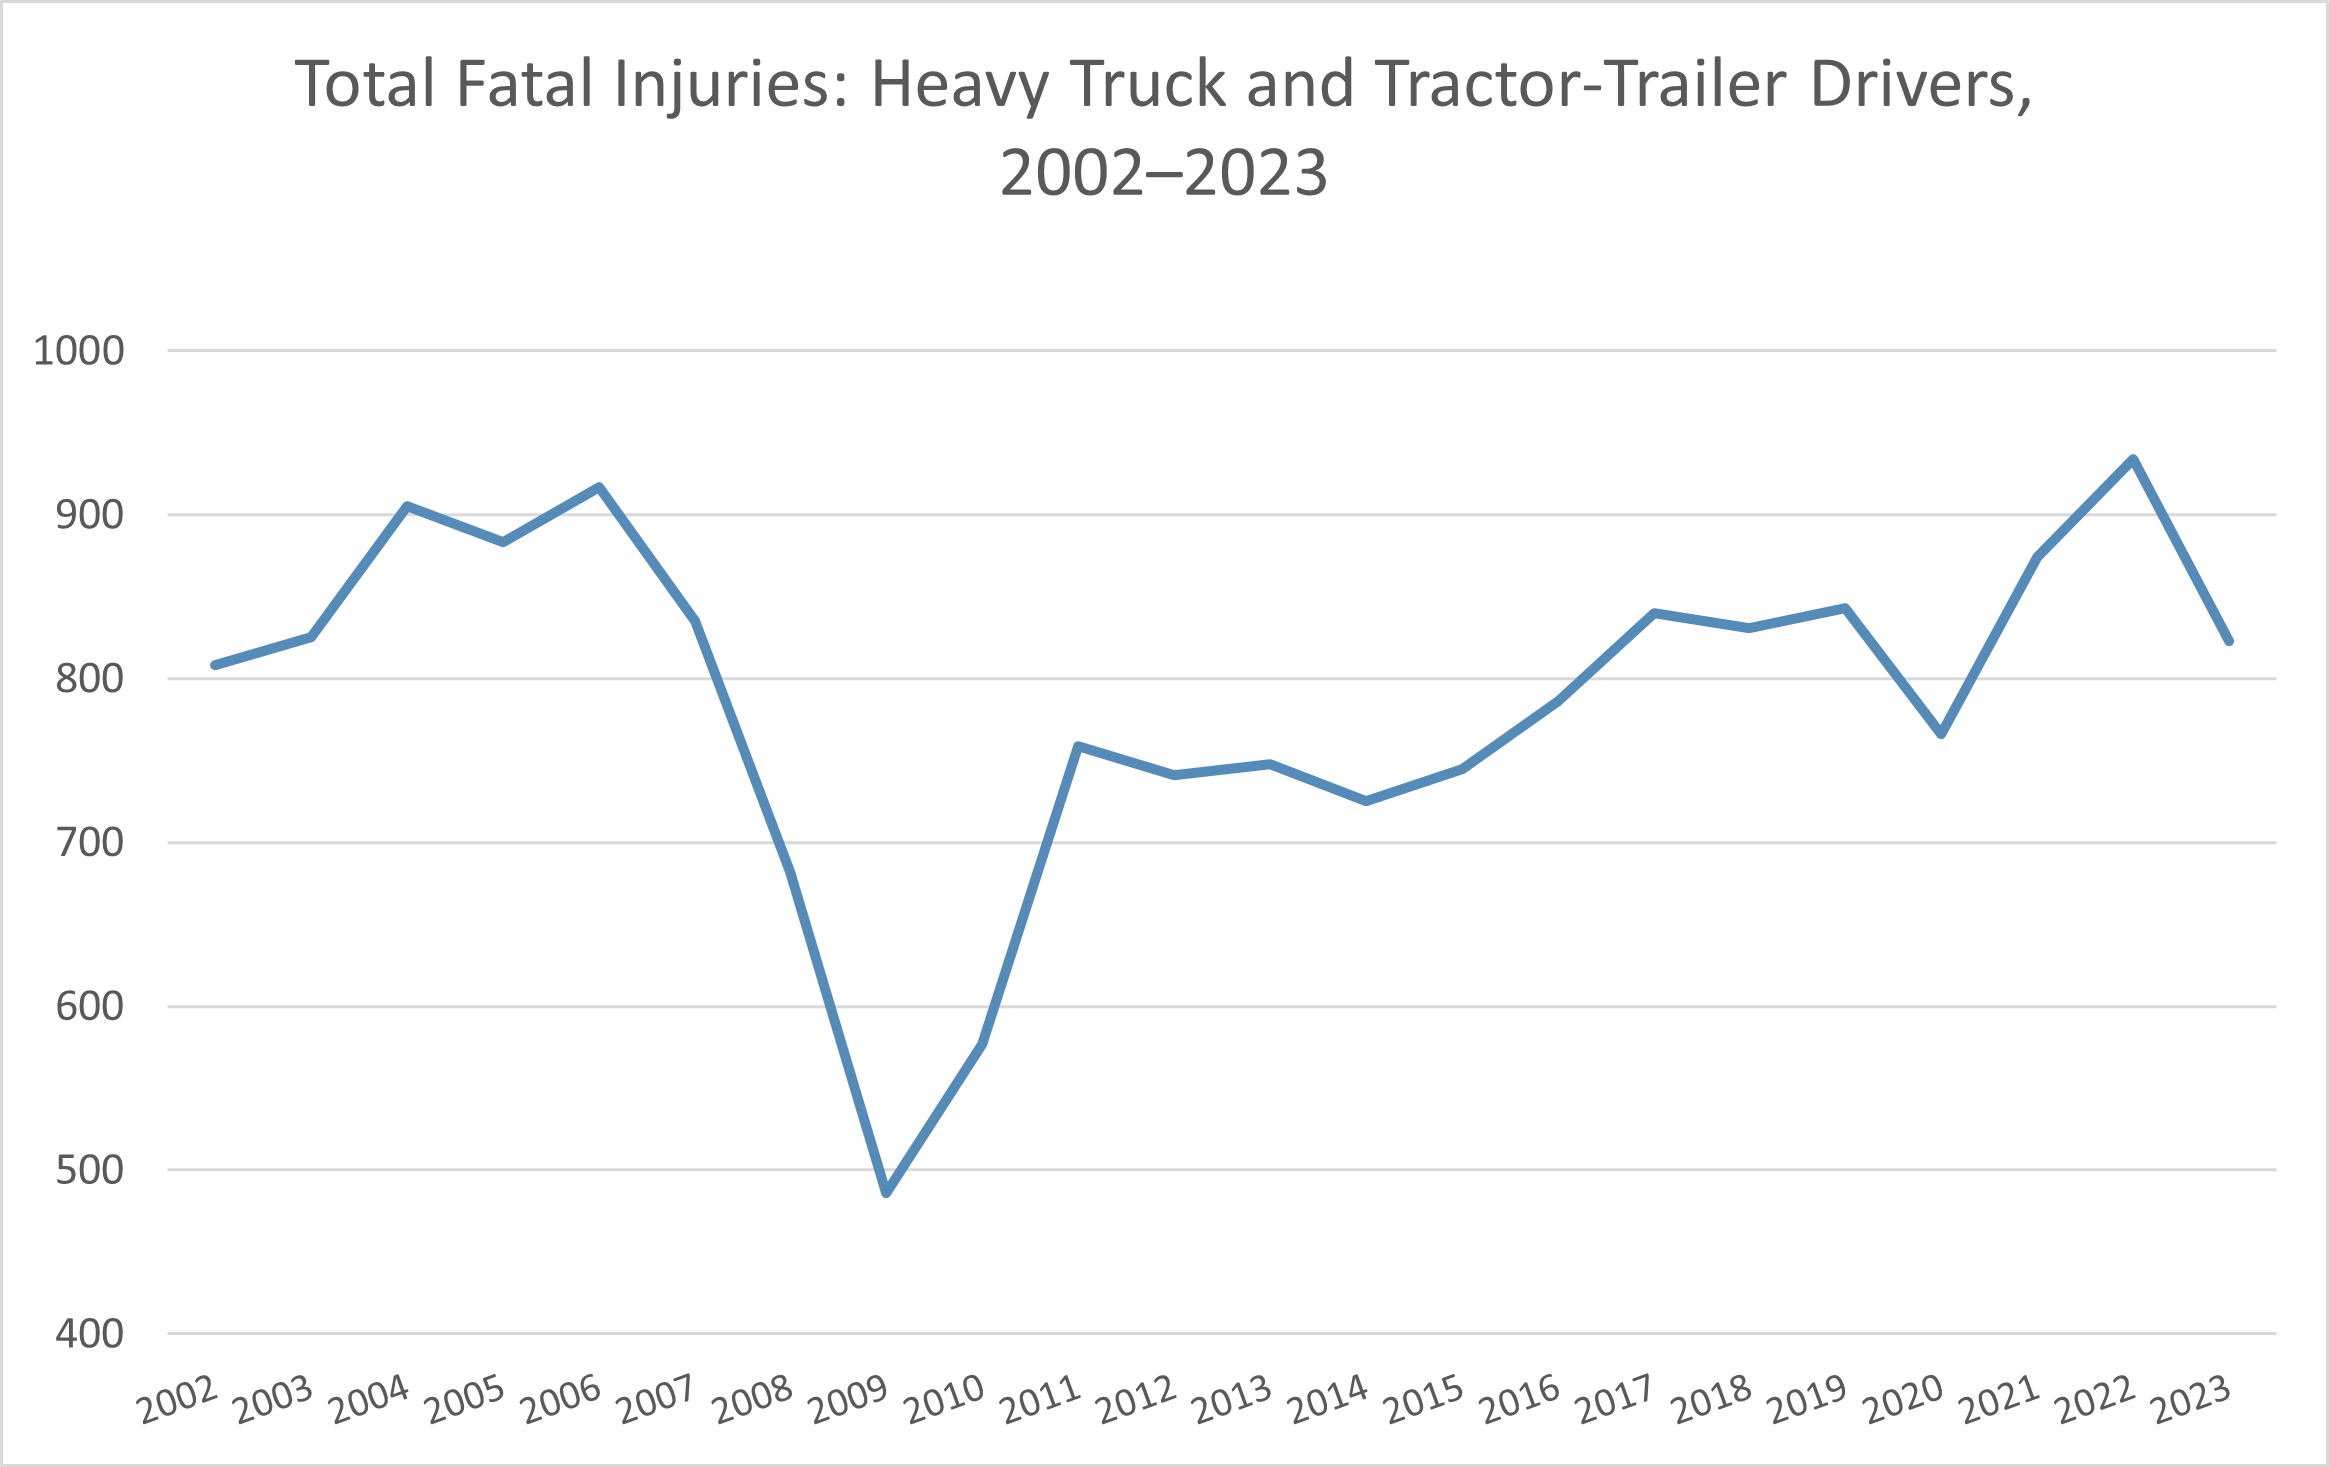
- In 2022, federal and state inspectors conducted a total of 2,879,966 inspections of commercial motor vehicles (CMVs), their drivers, or both. About 6.9% of the driver inspections resulted in placing the driver out of service (OOS). 22.6% of the vehicle inspections resulted in placing the vehicle OOS. 4.5% of the hazardous materials (hazmat) inspections resulted in placing the vehicle OOS. The five most frequent driver violations were failing to obey a traffic control device (sign, signal, etc.), speeding, falsifying a logbook entry, failing to wear a seat belt, and lacking a valid medical certificate (medical card). The five most frequent vehicle violations were a non-working required lamp; no proof of periodic inspections; improperly adjusted brakes; fire extinguisher missing, not working, or unsecured; and a non-working turn signal. The most common hazmat violations were improper documentation (such as labels or shipping papers) and unsafe cargo securement. (FMCSA, December 2023)
- In 2021, 5,700 large trucks were involved in fatal crashes, 60,375 large trucks were involved in injury crashes, and 116,468 were involved in towaway crashes. In this context, a “large truck” is a truck whose gross vehicle weight rating (GVWR) exceeds 10,000 pounds. (FMCSA, November 2023)
- In 2021, 54.2% of the large trucks involved in fatal crashes were semi-trucks (tractor/semi-trailer), 25.2% were 2-axle single-unit trucks, 8.3% were 3-axle single-unit trucks, and the rest were of other configurations. (FMCSA, November 2023)
- In 2021, 71.4% of the large trucks involved in fatal crashes had a gross vehicle weight rating (GVWR) of 26,001 pounds or greater, and 28.6% of the large trucks had a GVWR between 10,001 and 26,000 pounds. (FMCSA, November 2023)
- In fatal large truck crashes involving a passenger vehicle in 2021, the passenger vehicle rear-ended the truck far more often than the truck rear-ended the passenger vehicle. In head-on collisions, the passenger vehicle had crossed the center median far more often than the truck had. For less severe (injury or property-damage-only) crashes, these proportions tended to be more equal. (FMCSA defines “passenger vehicles” in this context as encompassing cars and light trucks (including pickups, vans, and SUVs). See the following chart. (FMCSA, November 2023)
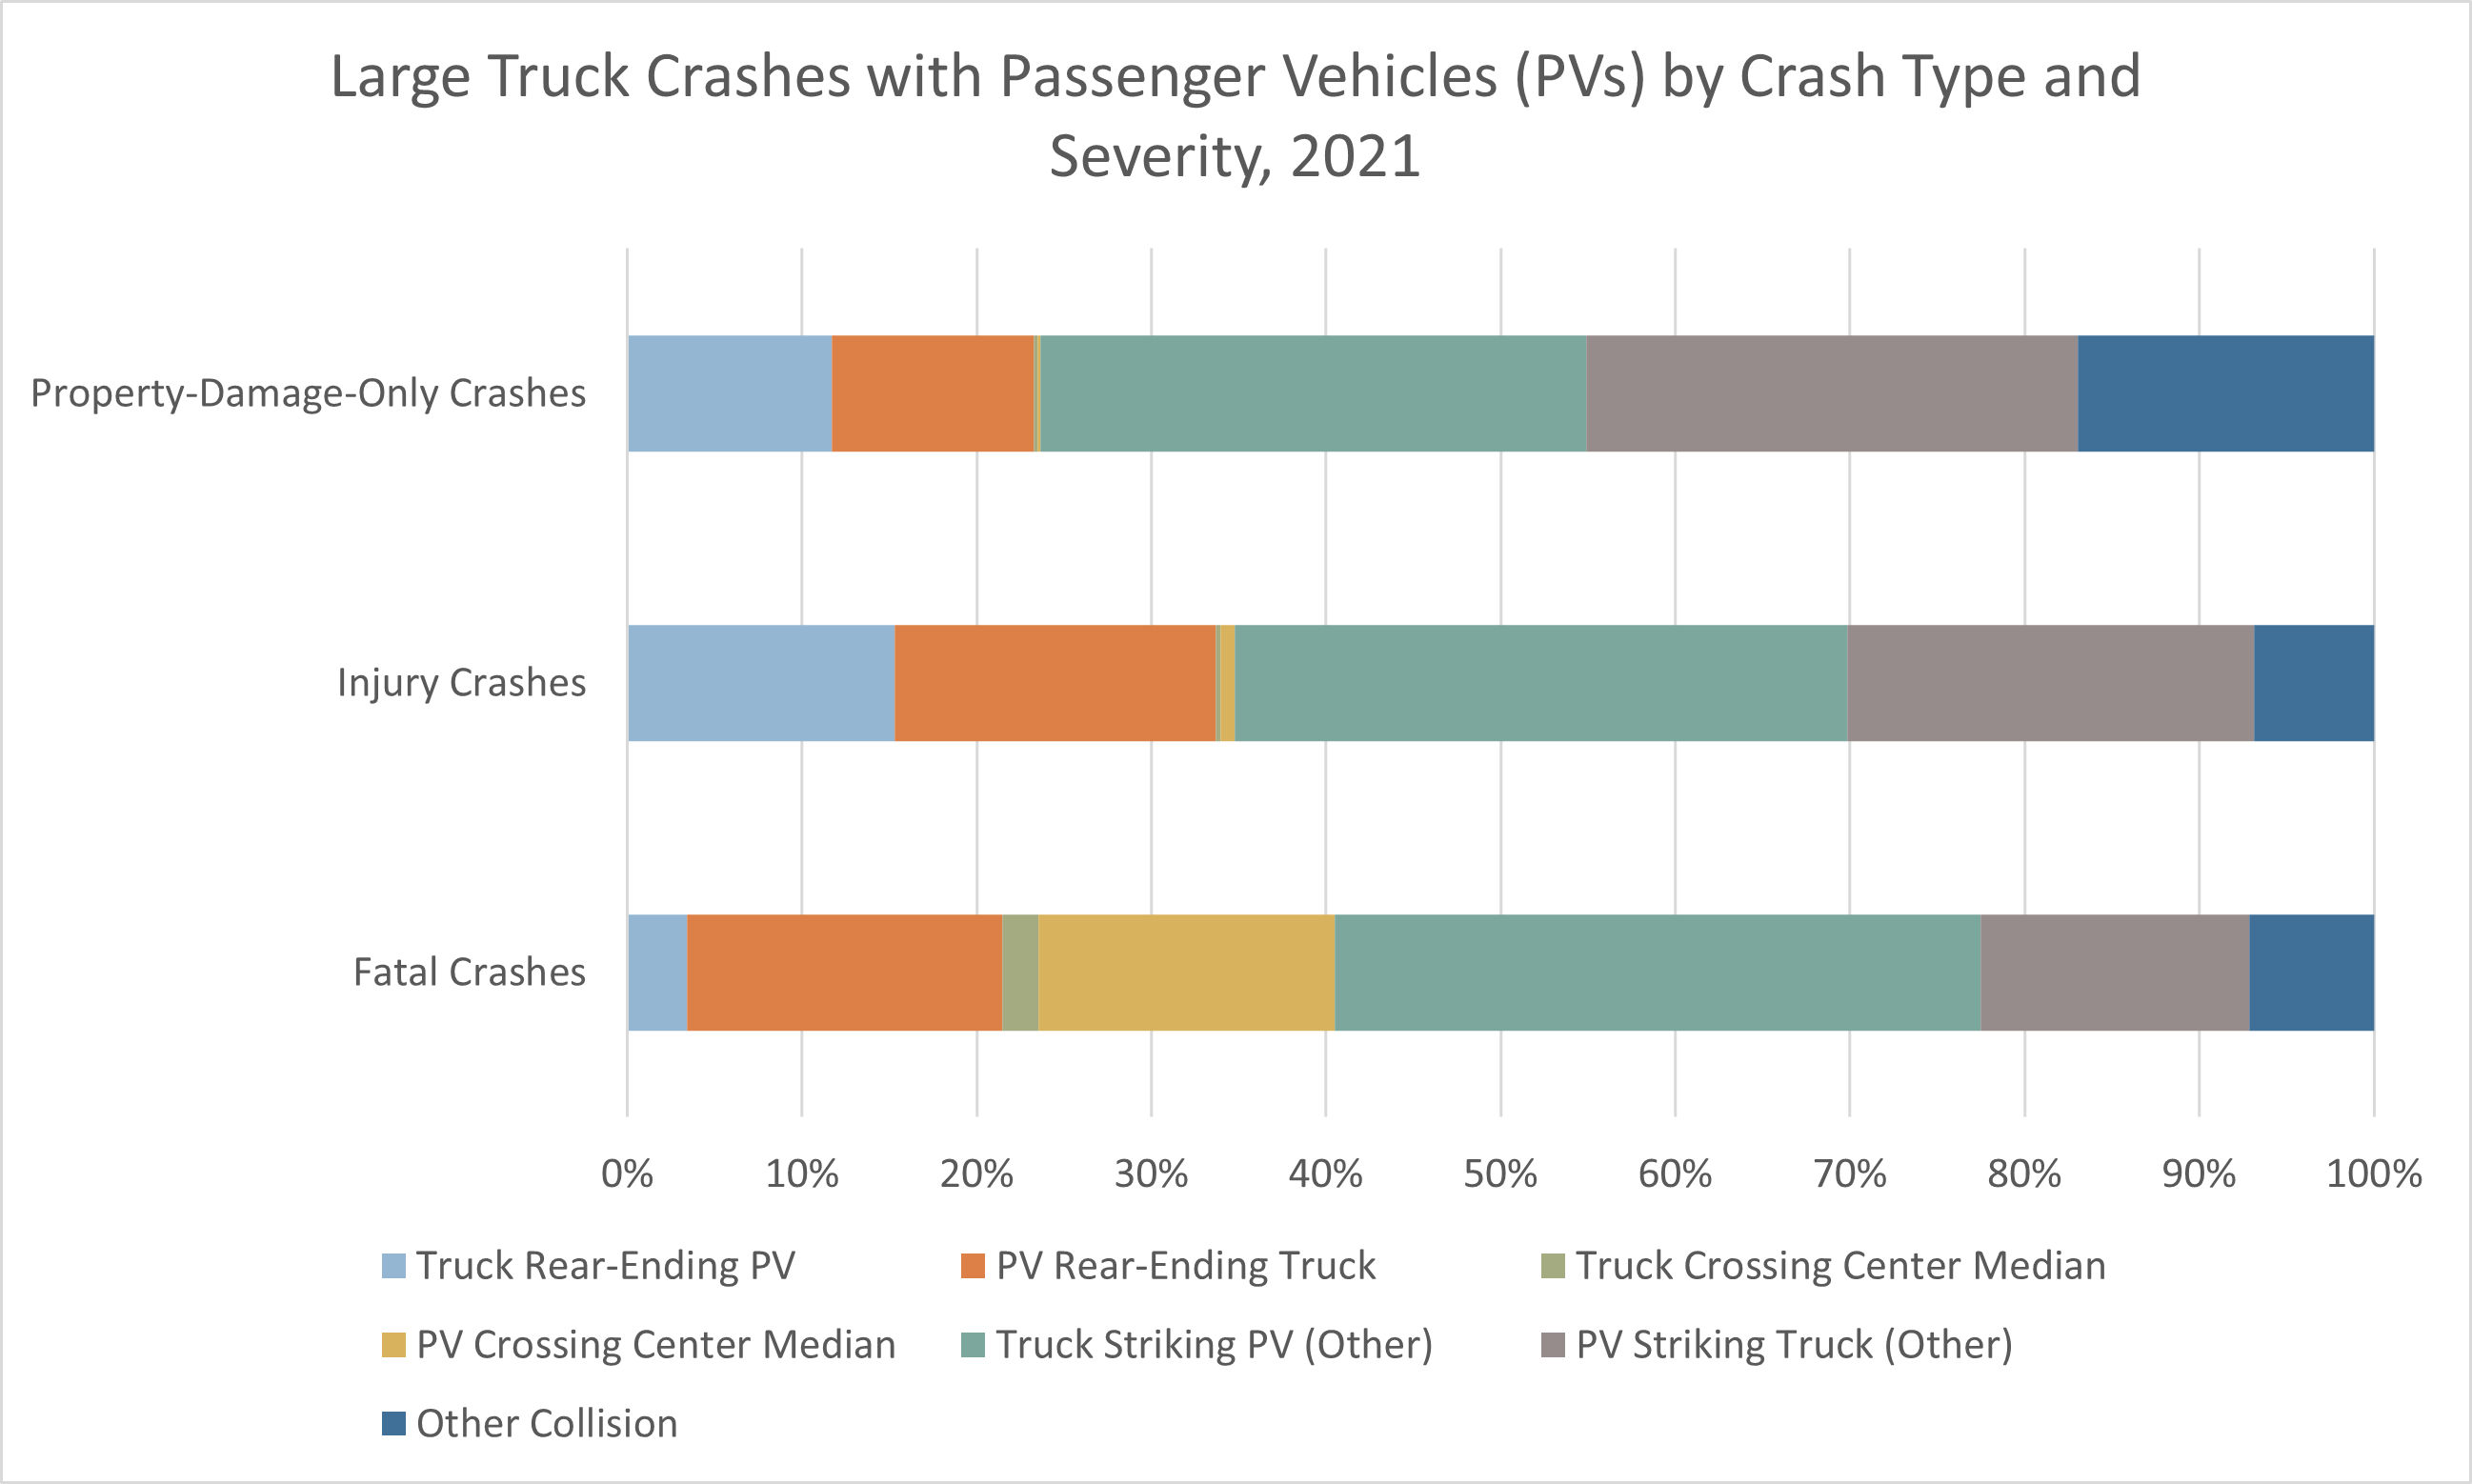
- In 2021, the five most common driver-related factors for large-truck drivers involved in fatal collisions were as follows: speeding (7.0% of the drivers), distraction or inattention (4.9%), careless driving (4.7%), failure to yield the right-of-way (4.5%), and impairment (alcohol, fatigue, illness, etc.) (4.2%). (FMCSA, November 2023)
- According to NHTSA, in 2022, 5,936 people were killed and 160,608 people were injured in crashes involving large trucks. (NHTSA, July 2024)
- In 2022, crashes of large trucks accounted for 11.2% of all motor vehicle crash deaths. (IIHS, June 2024)
- In 2022, large truck drivers were involved in 1.4 fatal crashes per 100 million miles traveled. In comparison, passenger car drivers were involved in 1.7 fatal crashes per 100 million miles traveled. (IIHS, August 2024)
- In 2021, approximately 54% of all fatal large-truck crashes occurred in rural areas, 26% occurred on interstate highways, and 12% fell into both categories by occurring on rural interstate highways. (FMCSA, November 2023)
- In 2021, 37% of all fatal large-truck crashes, 24% of all injury crashes, and 21% of all property-damage-only crashes involving large trucks occurred between 6 p.m. and 6 a.m. Also, 36% of fatalities in large-truck crashes occurred between 6 p.m. and 6 a.m. (FMCSA, November 2023)
- In 2021, 83% of fatal crashes involving large trucks and 87% of nonfatal crashes occurred on weekdays (Monday through Friday). (FMCSA, November 2023)
- From 2010 to 2021, the number of fatal crashes involving buses or large trucks increased by 52%. From 2016 to 2021, the number of injury crashes involving buses or large trucks increased by 6%, from about 112,000 in 2016 to about 119,000 in 2021. (FMCSA, November 2023)
- In 2021, the average speed limit where large trucks were involved in fatal crashes was 55.3 mph. Nevertheless, 21.1% of fatal large-truck crashes occurred when the speed limit was 60–65 mph, 18.4% when it was 70–75 mph, and 0.8% when it was 80–85 mph. (FMCSA, November 2023)
- In 2021, 33% of work zone fatal crashes and 15% of work zone injury crashes involved at least one large truck. (FMCSA, November 2023)
- In 2021, 1.8% of the large trucks involved in crashes and 2.7% of the large trucks involved in fatal crashes were carrying cargoes of hazardous materials (hazmat). Hazardous materials were released from 16.7% of the placarded trucks in those crashes. Flammable liquids (gasoline, fuel oil, etc.) comprised 42% of the hazmat releases from cargo compartments in fatal crashes and 49% of the hazmat releases in injury and towaway crashes. (FMCSA, November 2023)
- In 2023, there was a total of 24,289 hazardous materials transportation incidents, which cost a total of $940,747,698 in damages. More incidents (45.0% of the total) occurred during unloading than in transit (34.7%). However, the cost of damages from incidents in transit (99.2% of the total cost) dwarfed damage costs from incidents in other transportation phases by a huge margin. There were also more injuries and fatalities sustained during the in-transit incidents. See the following table. (PHMSA, March 2024)
|
Transportation Phase |
HazMat Incidents |
% of Total Incidents |
Hospitalized Injuries |
Non-Hospitalized Injuries |
Fatalities |
Damages |
% of Total Damages |
|
In Transit |
8,436 |
34.7% |
14 |
50 |
12 |
$933,042,874 |
99.2% |
|
In Transit Storage |
785 |
3.2% |
0 |
7 |
0 |
$2,085,737 |
0.2% |
|
Loading |
4,140 |
17.0% |
2 |
0 |
0 |
$2,291,415 |
0.2% |
|
Unloading |
10,928 |
45.0% |
3 |
11 |
0 |
$3,327,672 |
0.4% |
Bus Driving Statistics
- As of May 2024, the average annual wage for transit and intercity bus drivers was $58,390. The average annual wage for school bus drivers was $46,660. See the following table. (Bureau of Labor Statistics, accessed April 2025)
|
|
Transit/Intercity Bus Drivers |
School Bus Drivers |
|
Annual 10th percentile wage |
$38,250 |
$27,680 |
|
Annual 25th percentile wage |
$46,050 |
$37,490 |
|
Annual median wage |
$57,440 |
$47,.040 |
|
Annual mean (average) wage |
$58,390 |
$46,660 |
|
Annual 75th percentile wage |
$69,090 |
$56,140 |
|
Annual 90th percentile wage |
$82,640 |
$63,810 |
- In the United States and Canada in 2020, the motorcoach industry made 124,577,400 passenger trips. Motorcoach carriers made an average of 66,512 passenger trips each, and coach buses made an average of 4,037 passenger trips each. (FMCSA, December 2023)
- As of May 2024, there were 387,920 school bus drivers employed in the United States. (Bureau of Labor Statistics, May 2024)
- Bus travel is much safer than passenger car travel, although not as safe as air travel. In 2022, US passenger fatalities per billion passenger miles were the highest by far for motorcycle travel and the lowest by far for air travel. See the following table. (Voronoi, December 2024)
|
Passenger Travel Mode |
Passenger Fatality Rate per Billion Passenger Miles (2022) |
|
Motorcycles |
255.0 |
|
Cars and trucks |
6.0 |
|
Rail transit |
2.0 |
|
Bus transit |
1.0 |
|
Air travel |
0.03 |
- Of the buses involved in fatal crashes in 2021, 37% were school buses, 36% were transit buses, and 11% were intercity (coach) buses. (FMCSA, November 2023)
- In 2023, there were 235 bus crashes resulting in a total of 263 fatalities. 239 buses were involved in these crashes: 34 buses with seats for 9–15 occupants and 205 buses with seats for more than 15 occupants. ("Occupants" included the driver as well as the passengers.) (FMCSA, accessed May 2025)
- Every school bus on the road carries as many students as approximately 36 cars. That’s the equivalent of 62 billion miles of car driving, 2.6 billion gallons of car fuel, and more than 20 million tons of CO2 emissions. (American School Bus Council, accessed April 2025)
- School buses carry over 26 million of the 50 million students who go to school each day. (American School Bus Council, 2024)
- It would take over 17 million cars to transport all the students currently riding on all school buses in the United States. (American School Bus Council, accessed April 2025)
- Students are about 70 times more likely to get to school safely when taking a school bus than by traveling by car. Of the children killed in traffic crashes during school travel hours, fewer than 1% died when traveling by school bus. 57% died when riding in a car driven by a teenage driver, 23% died when riding in a car driven by an adult driver, and 19% died when traveling some other way. (American School Bus Council, accessed April 2025)
- Almost one-third of those who died taking a school bus to school were killed while they were approaching or leaving the bus. (NHTSA, 2016)
- In 2021, there were 80 school buses, 17 intercity (coach) buses, and 78 transit buses involved in fatal crashes. These numbers had been declining for years even before the COVID pandemic. (In 2001, 117 school buses, 38 intercity buses, and 103 transit buses had been involved in fatal crashes.) (FMCSA, November 2023)
- Fewer than 1% of all traffic fatalities nationwide involve school buses. (NHTSA, 2024)
- From 2013 through 2022, there was a total of 1,082 fatalities in traffic crashes involving school transportation vehicles (school buses and other types of vehicles being used to transport schoolchildren). Most (71%) of these fatalities were occupants of other vehicles involved in the crash. 16% of the fatalities were pedestrians (often schoolchildren) who were hit when outside any vehicle. 11% of the fatalities had been hit by the school transportation vehicle itself. Only 6% of the fatalities were passengers of the school transportation vehicles. 5% of the fatalities were drivers of those vehicles. (NHTSA, August 2024)
- 33% of the schoolchildren who are killed in school bus-related accidents were 5 to 7 years old. 66% of the fatalities during loading or unloading of school buses were hit by passing vehicles (even though it is illegal in every state to pass a school bus when its red lights are flashing). (American School Bus Council, 2024)
- In a survey of school bus drivers in 2024, 98,065 school bus drivers from 36 states (making up about 26.4% of America’s school bus drivers) reported that 66,322 vehicles illegally passed their buses on a single day during the 2023–2024 school year. Extrapolating to 100% of the nation’s school bus drivers would mean that slightly over 251,000 illegal passings may have taken place on just that one day. (National Association of State Directors of Pupil Transportation Services, July 2024)
Taxi/Ridesharing/Limousine Statistics
- As of 2023, there were 393,400 persons employed as taxi drivers, shuttle drivers, and chauffeurs. (Bureau of Labor Statistics, 2025)
- As of May 2024, the average annual salary for taxi drivers was $39,310, and the median annual salary was $36,220. Annual salaries ranged from $27,280 (10th percentile) to $61,920 (90th percentile). (Bureau of Labor Statistics, May 2024)
- As of April 2025, the average annual salary for rideshare drivers (e.g., Uber, Lyft) was $43,925, ranging from $29,500 (25th percentile) to $41,500 (75th percentile) and a maximum annual salary of about $80,000. However, the average annual salary did not include additional pay from bonuses, tips, or commissions, which could add about $8,000 to the driver’s annual salary. (ZipRecruiter, April 2025)
- In 2025, 53% of taxi drivers worked full time and 47% worked part time. (CareerExplorer, accessed April 2025)
- In 2023, there were 44 work-related deaths of taxi drivers and chauffeurs, none of which were caused by violent acts. In comparison, there were 69 work-related fatalities in 2008. There were 32 homicides of taxi drivers and chauffeurs in 2012. (Bureau of Labor Statistics, January 2020)
- In 2021, the global ridesharing market was estimated at $95.1 billion. About 26% of the US population used ridesharing at least once per month. (Zippia, June 2023)
- In 2021, Uber controlled 71% of the US ridesharing market, and Lyft controlled 29%. Between them, they controlled practically the entire US ridesharing market, which represented one of the biggest duopolies in the United States. Combined, Uber and Lyft were responsible for about 6% of total vehicle miles traveled (VMT) in the United States. (Zippia, June 2023)
- According to data from 3Q 2024, Uber employed about 7.8 million drivers and couriers in more than 10,000 cities in about 70 countries worldwide. This figure represents a substantial increase from the 6.8 million drivers and couriers employed by Uber in 3Q 2023. Some drivers have been known to work for both Uber and Lyft.
- In 2021, 43% of all Uber trips in the US were travel to dinners or parties. 53% of Americans earning over $75,000 per year used ride-sharing services, compared with only 24% of Americans earning less than $30,000 per year. (PolicyAdvice, 2021)